-
Type:
Documentation task
-
Resolution: Fixed
-
Priority:
 Trivial
-
Affects Version/s: None
-
Component/s: Documentation (D)
-
None
-
Documentation backlog
-
1
Steps to reproduce:
- Create a template
- create a dashboard
- Create a single page
- Attach a `Graph prototype` widget , showing `SNMP Interface Traffic` in my example, but any data set behaves the same
- Attach the template to a host
- View the Monitoring>Hosts>Dashboard adjacent to the host > click on the page> view the graph `Interface: Traffic`
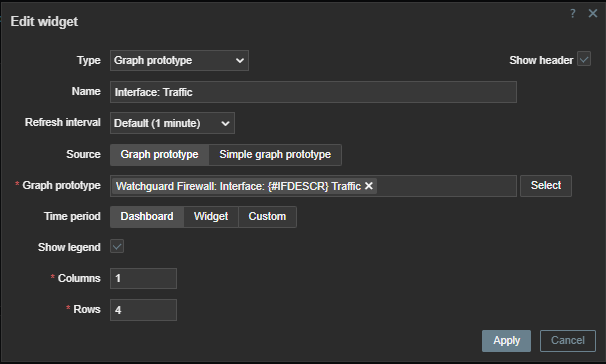
Configuration:
This is the configuration of the Widget:

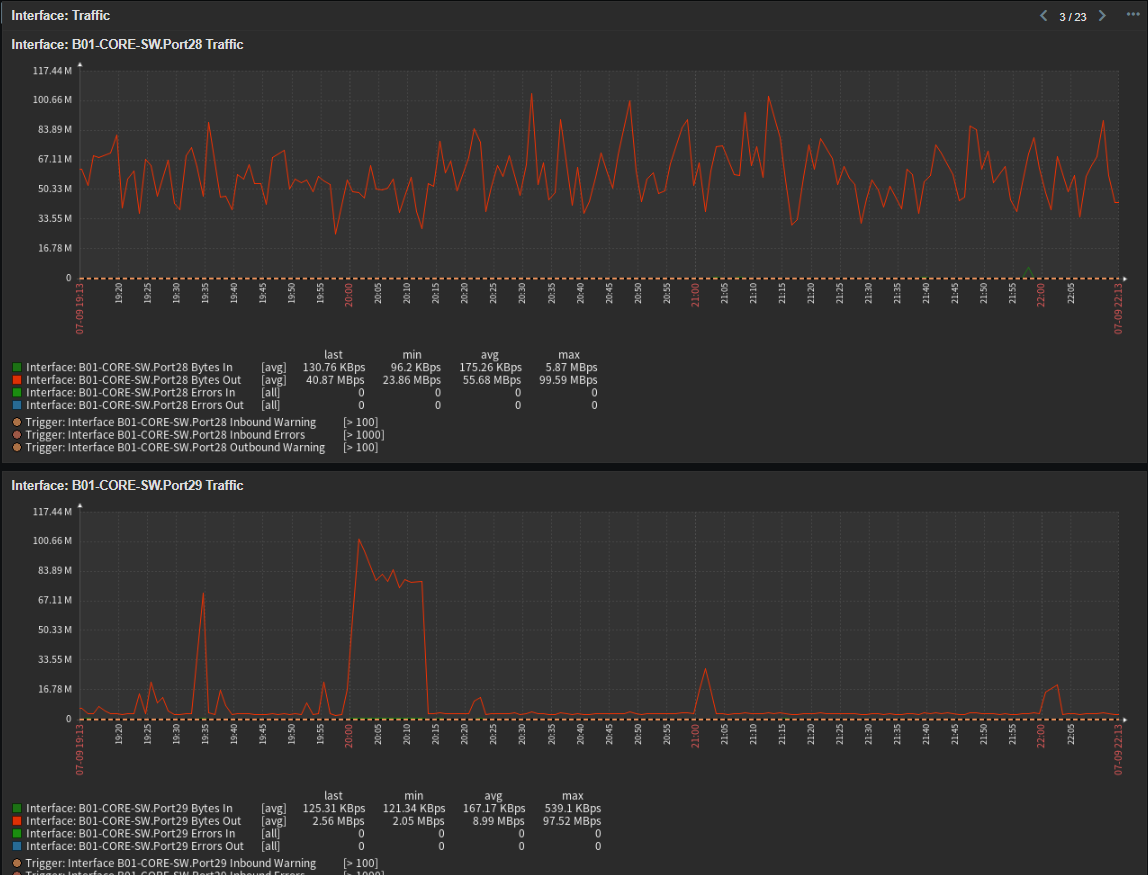
Result:
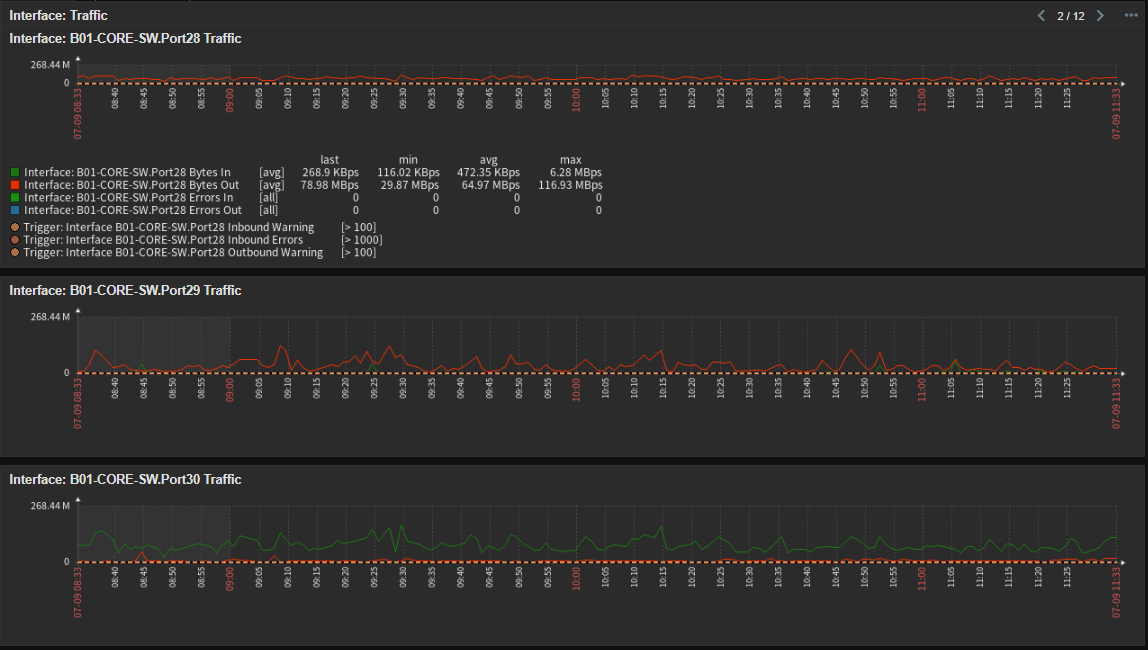
Note: I clipped the bottom chart off this picture, as it had a client-name in the interface description, i'm not permitted to share this.
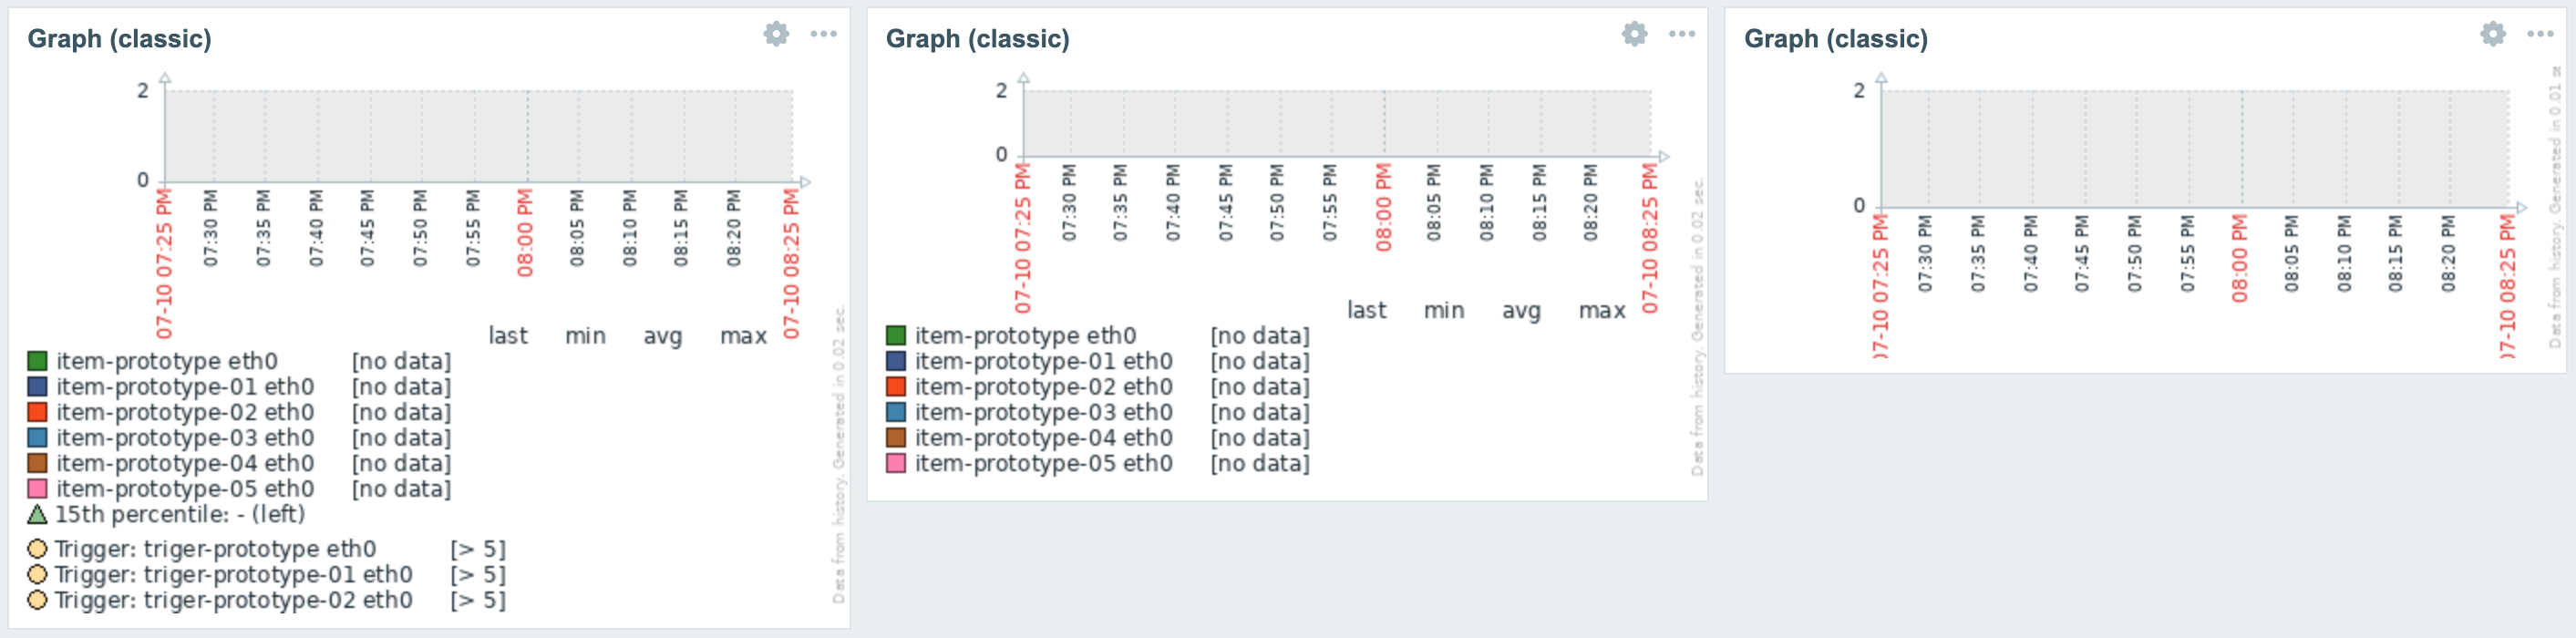
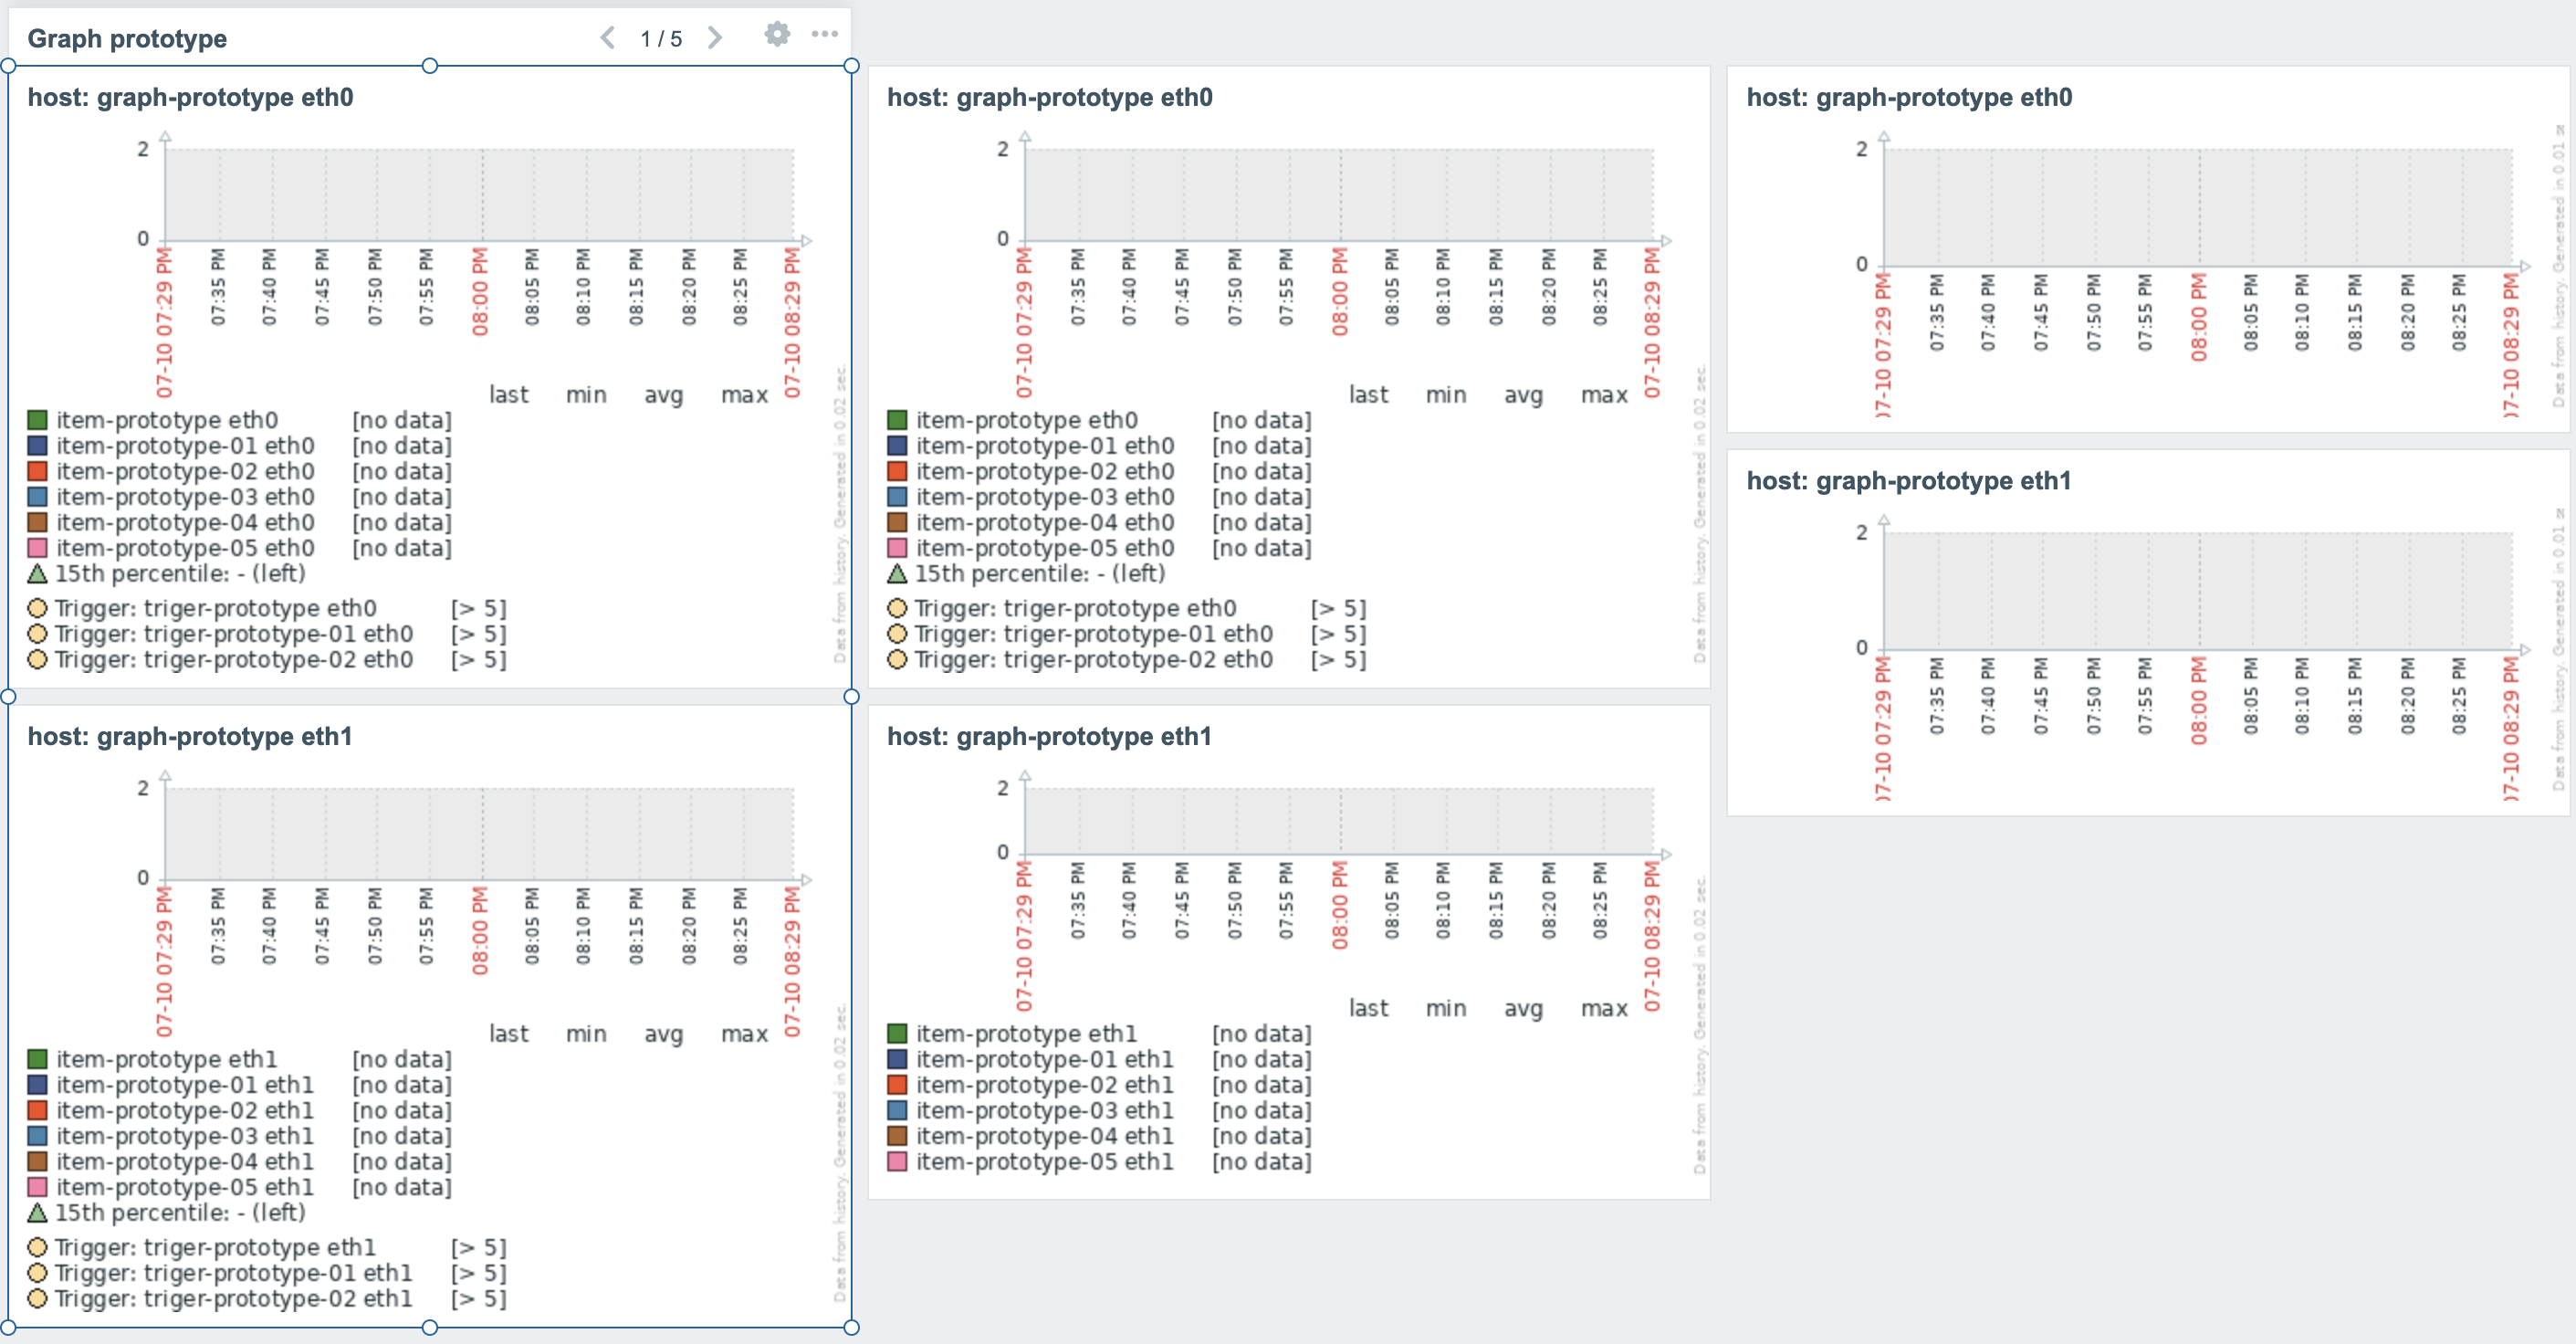
Expectations:
The 'legend' is checked in the graph_prototype defintion, therefore this should be visible on ALL graphs.
The 'legend' tick has automatically included the associated triggers; whilst i never asked for this, it's a great thing to be able to toggle on/off. So maybe expand on this by adding a 'show triggers' button in the widget editor.