-
Type:
Problem report
-
Resolution: Unresolved
-
Priority:
 Trivial
-
None
-
Affects Version/s: 7.4.2
-
Component/s: Frontend (F)
Steps to reproduce:
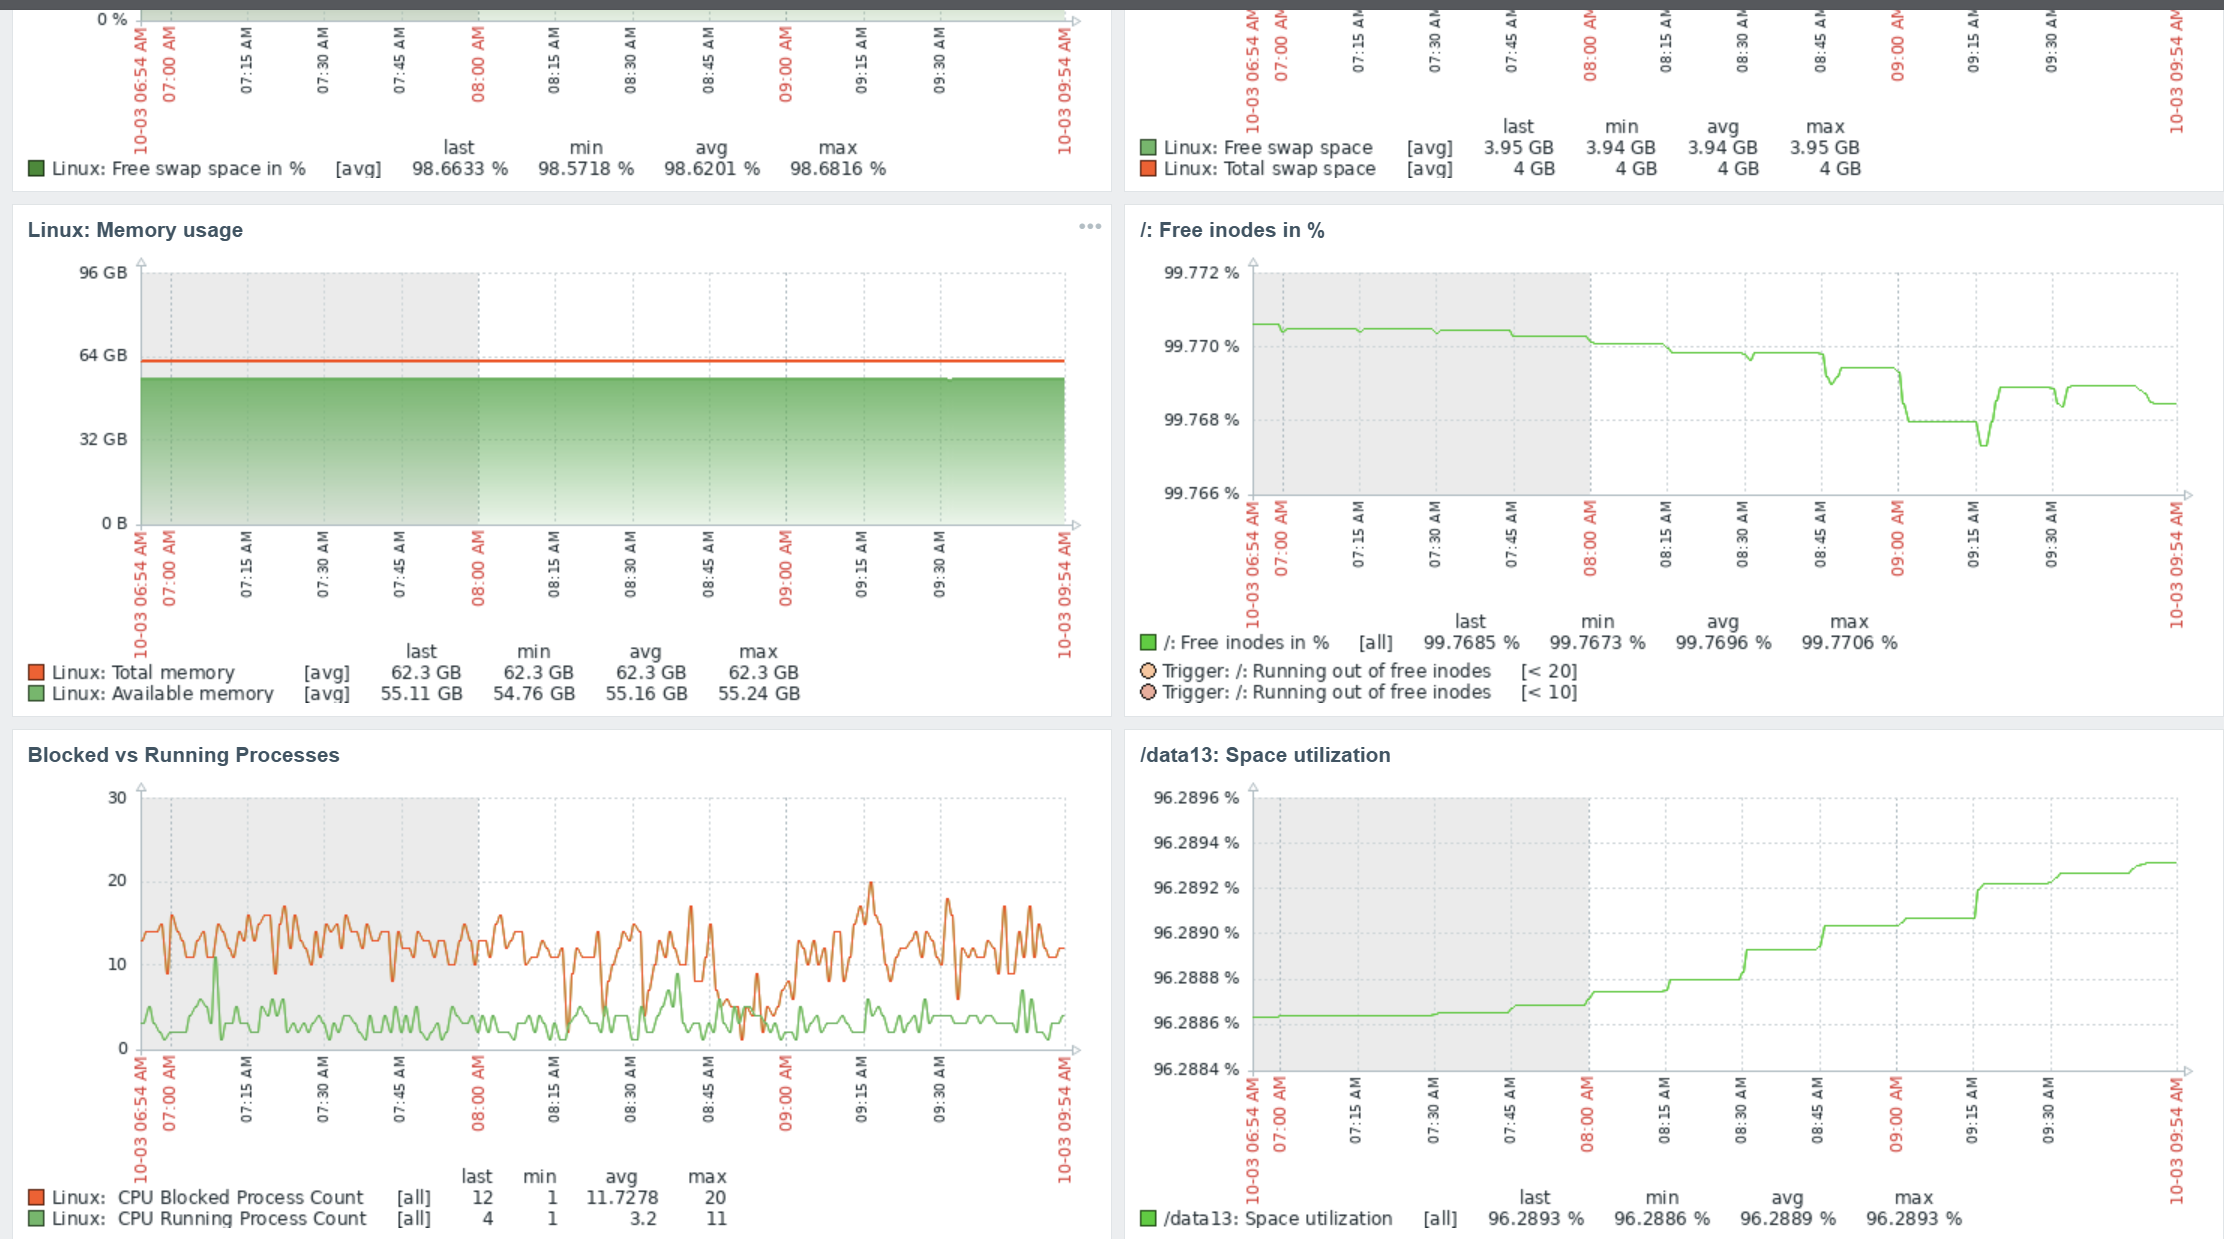
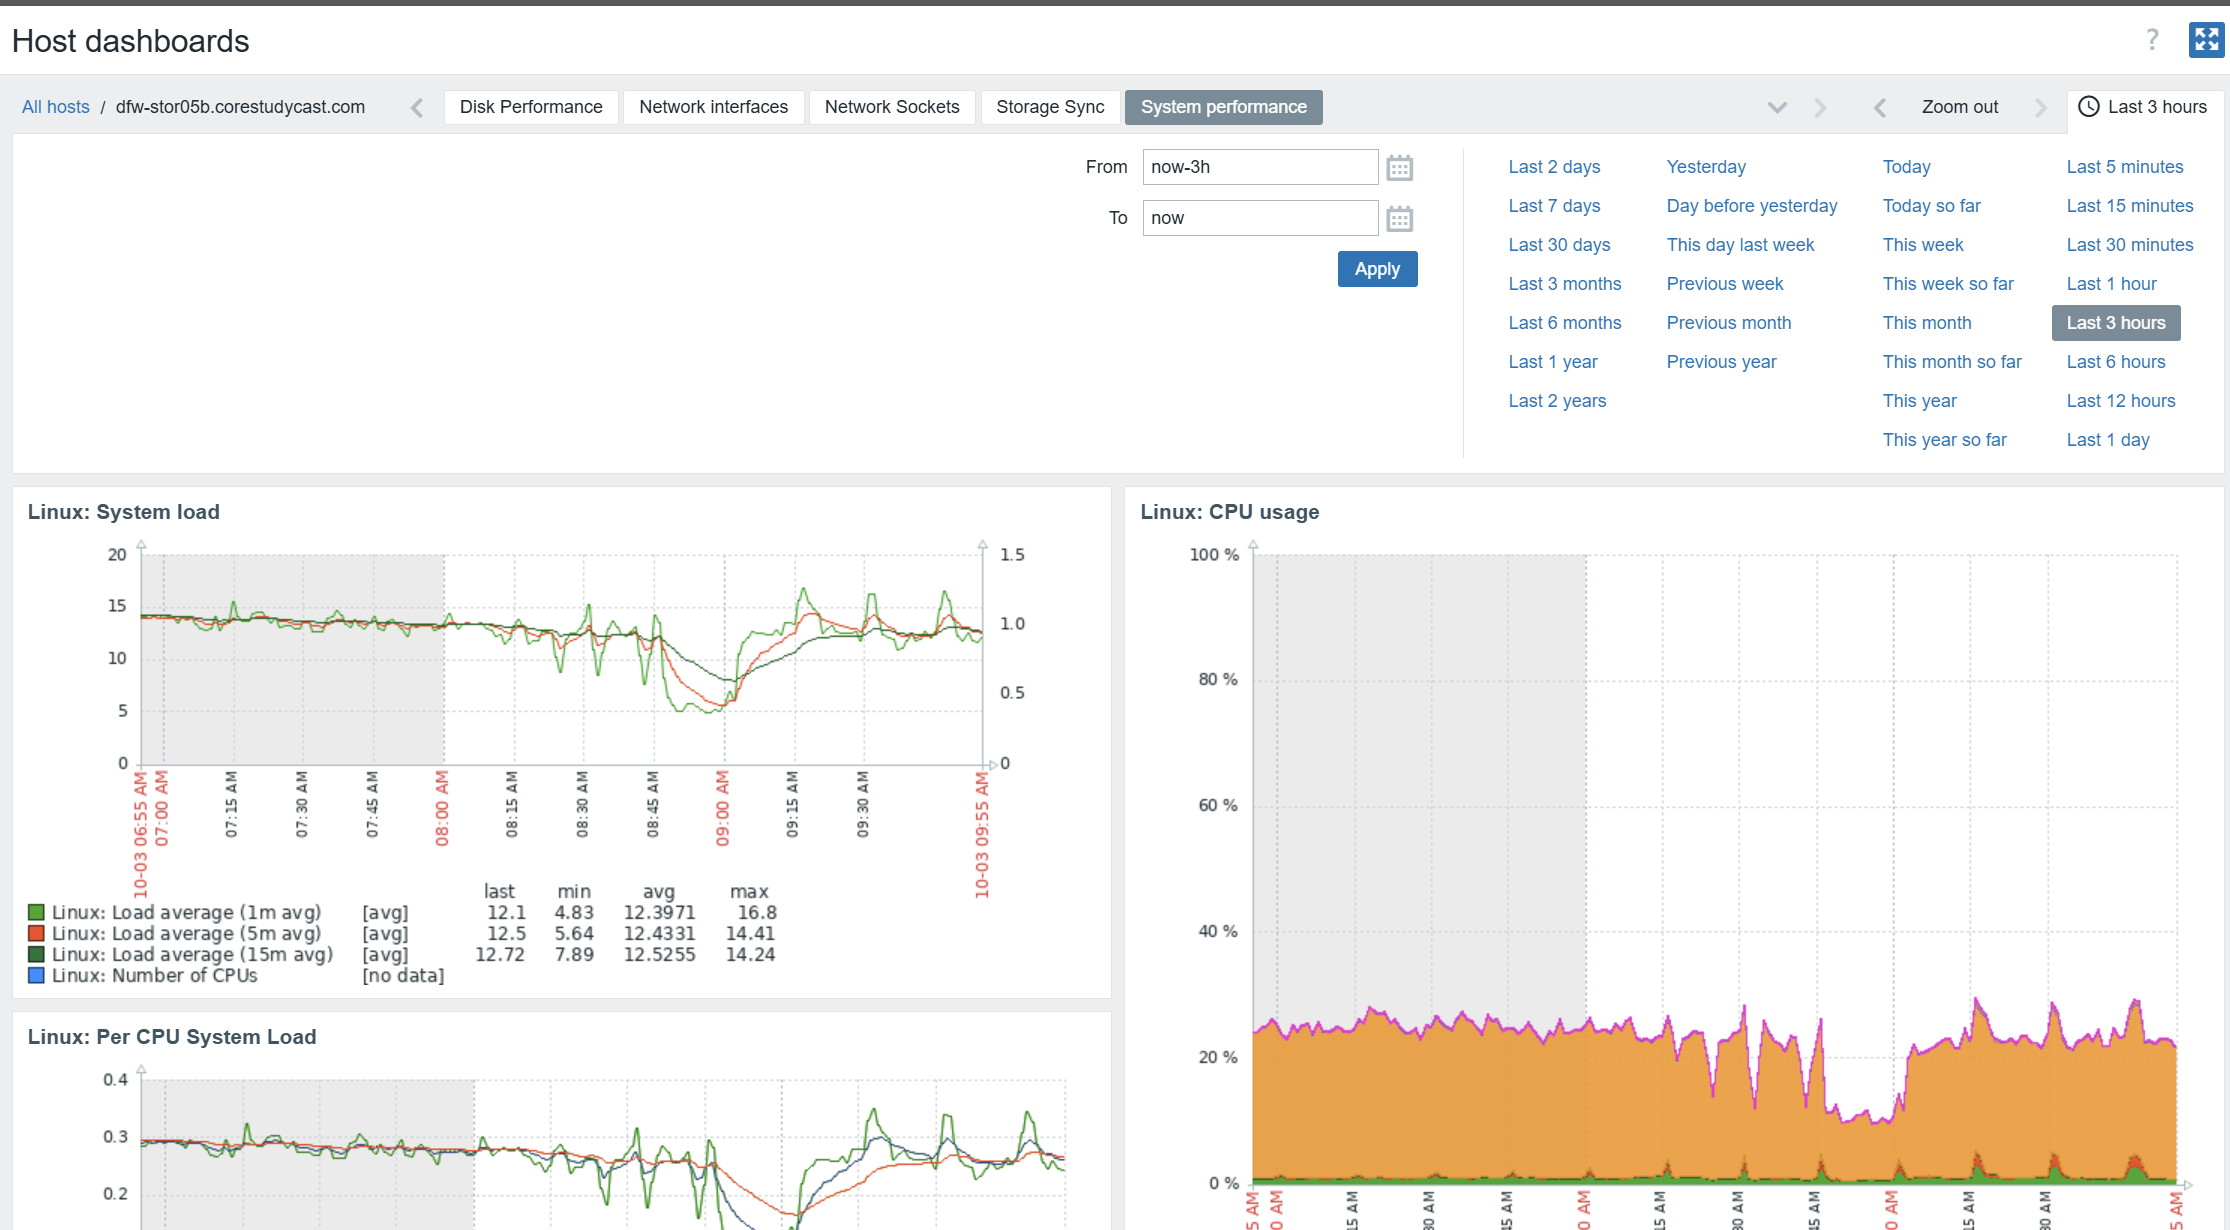
- Choose a dashboard for a client.
- Choose a graph that has multiple elements (like disks, nics, filesystems, etc).
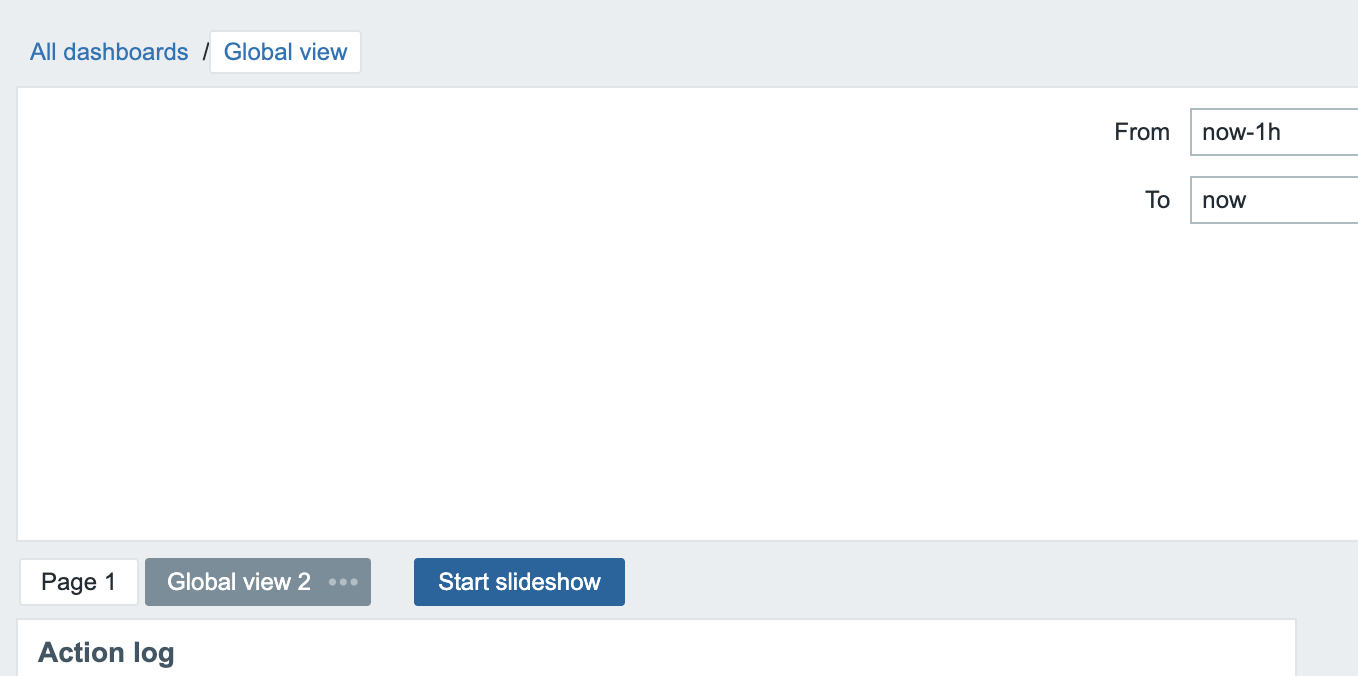
- Click over to a secondary page on the graph
- Wait
Result:
When the dashboard refreshes, the entire page resets to the defaults. You are also taken back to the top of the page. This is extremely frustrating when trying to investigate an issue. This did not happen in 6.4 prior to upgrade.
Expected:
Refresh the data and graphs, but do not change page position or sub-graph selection.