-
Type:
Problem report
-
Resolution: Fixed
-
Priority:
 Minor
Minor
-
Affects Version/s: 7.0.18
-
Component/s: Frontend (F)
-
S26-W04/05, S26-W06/07, S26-W10/11, S26-W12/13
-
1
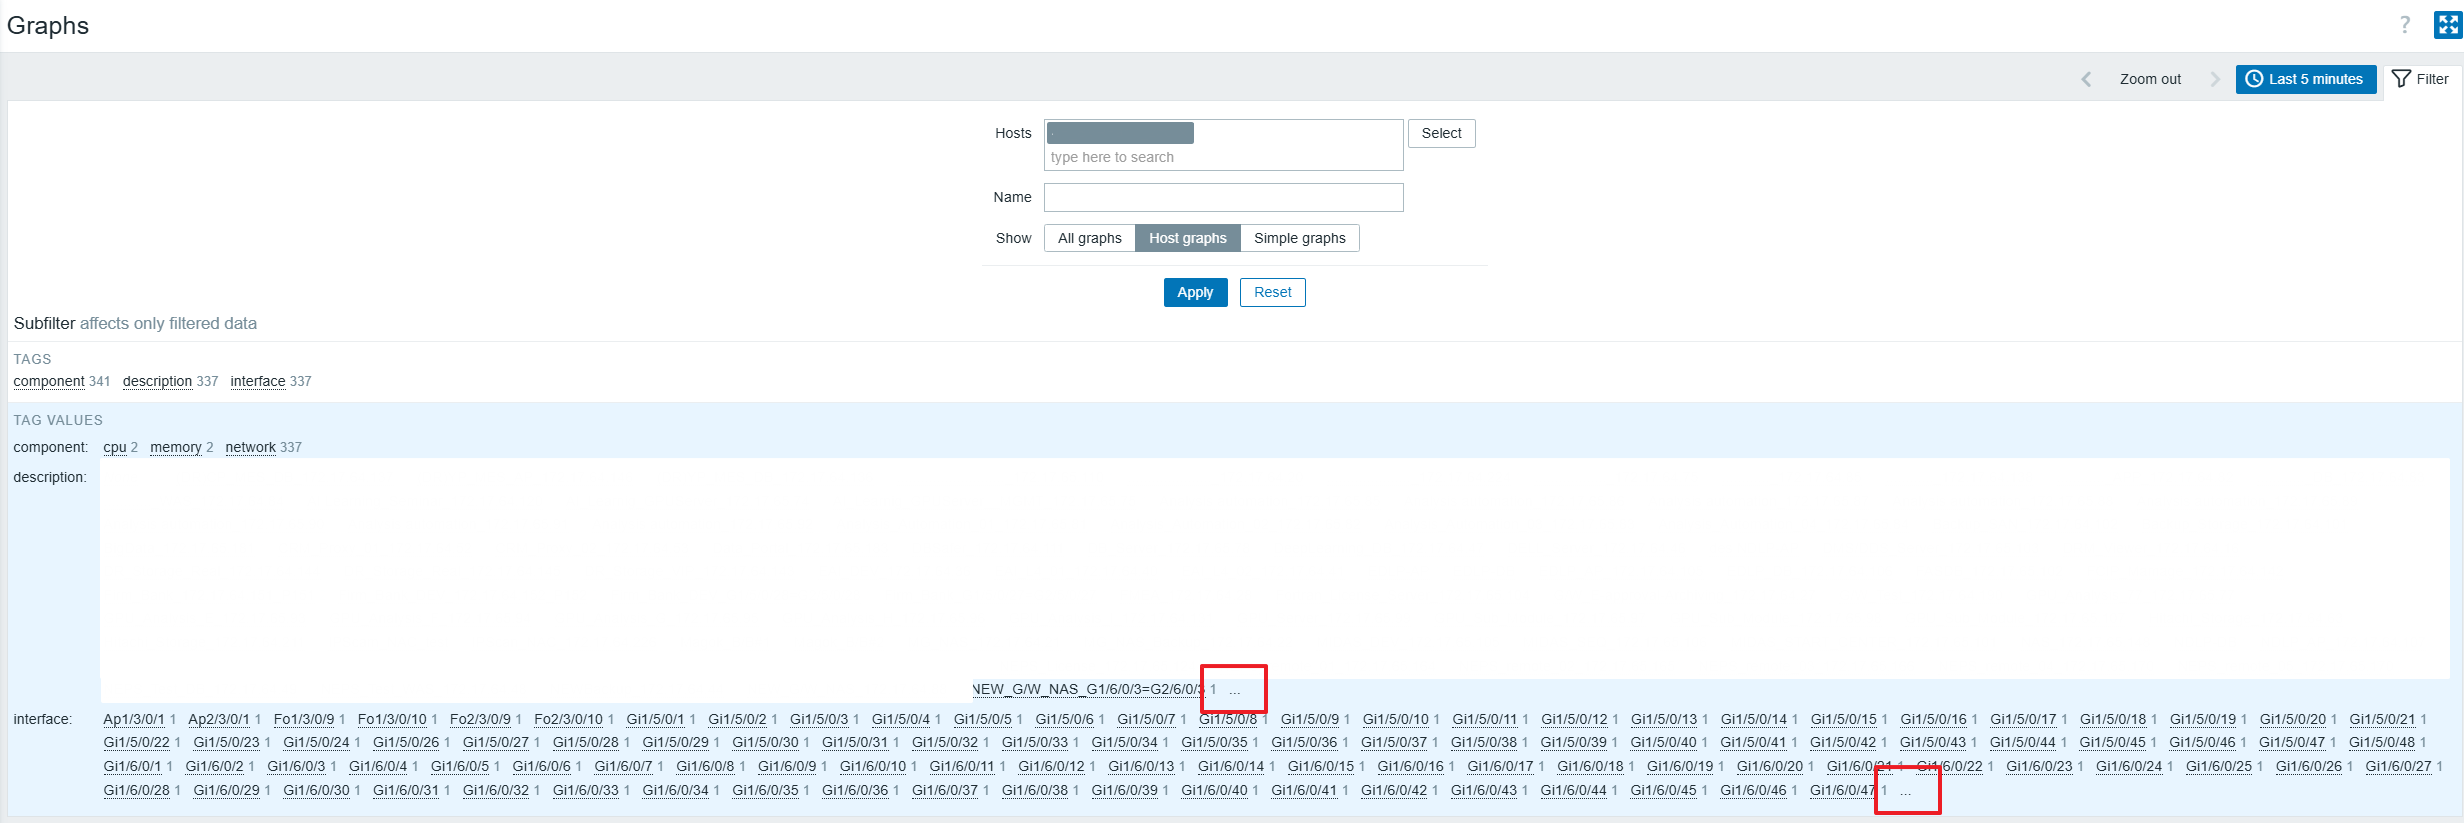
Monitoring → Hosts → Graph:
- When viewing graphs and selecting a specific time range, the selected time changes unexpectedly when navigating to another page.
- If we change the time range while on, for example, page 6 of the graph list, the view jumps back to page 1 instead of staying on the current page.
- When a host has many interfaces, the interface list in the Graph view is cut off, making it difficult to select the desired interface. It would be very helpful if an expand button, similar to the one available in Latest data, could be added.