-
Type:
Incident report
-
Resolution: Unresolved
-
Priority:
 Trivial
-
None
-
Affects Version/s: None
-
Component/s: None
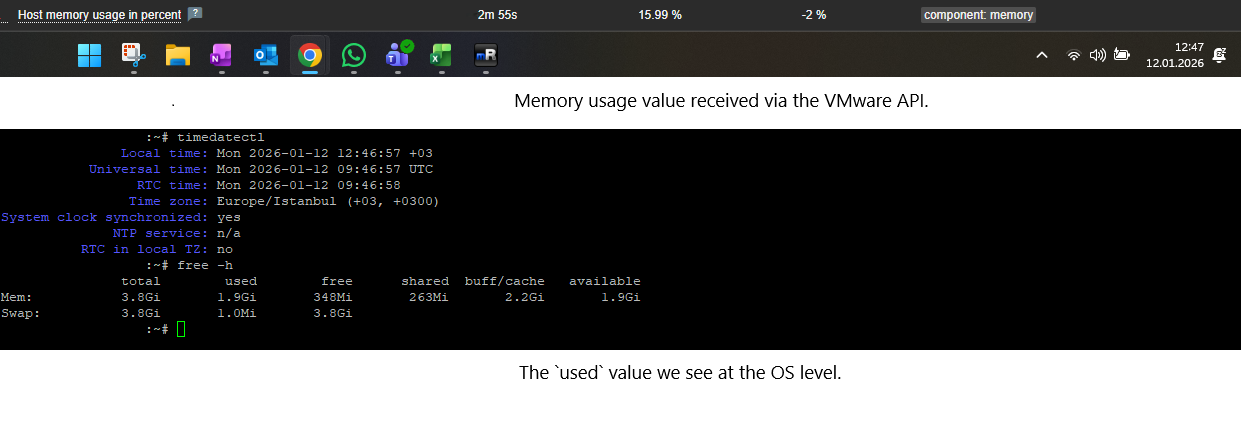
We are experiencing inconsistent memory usage values between VMware-based monitoring and OS-level monitoring in Zabbix.
Issue Details:
- VMs discovered via the VMware hypervisor show a memory usage value that does not match the real usage inside the guest OS.
- Zabbix Agent/Agent2 running inside the VM reports significantly different memory statistics.
- “Active Memory” metrics (e.g., from VMware performance counters) cannot be collected — Zabbix either returns unsupported items or does not expose the metric at all.
- The mismatch creates confusion in dashboards and alerting because VMware-based and OS-based metrics contradict each other.
Environment:
- Zabbix Server: 7.0.19
- VMware vCenter version: (fill this)
- Zabbix VMware Discovery using template: Template VM VMware Hypervisor
- OS Agents: Zabbix Agent/Agent2 on Windows/Linux (fill)
Steps to Reproduce:
- Discover VMs through VMware in Zabbix.
- Compare:
-
- vmware.vm.memory.usage
-
- OS-level memory usage from agent (e.g., vm.memory.size[available], vm.memory.size[total], etc.)
- Attempt to collect active memory metrics (e.g., mem.active.average)
- Observe the mismatch and missing values.
Expected Result:
- Zabbix should report memory usage consistently between VMware and OS-level metrics.
- VMware Active Memory should be available as an item or have a clear documented limitation.
Actual Result:
- Memory utilization differs significantly between VMware and OS-level values.
- Active Memory values are not available / cannot be collected.