-
Type:
Problem report
-
Resolution: Unresolved
-
Priority:
 Trivial
-
None
-
Affects Version/s: 7.0.21
-
Component/s: Frontend (F)
Steps to reproduce:
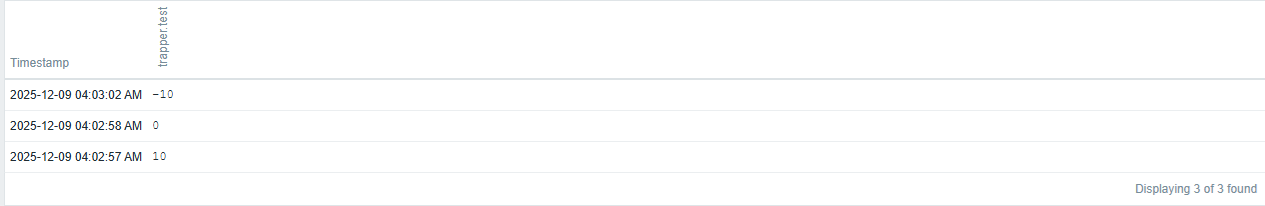
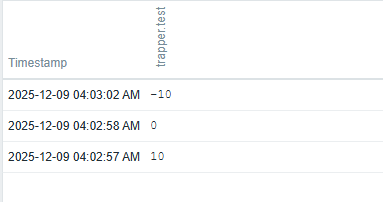
- Create item and generate some values.
Values:
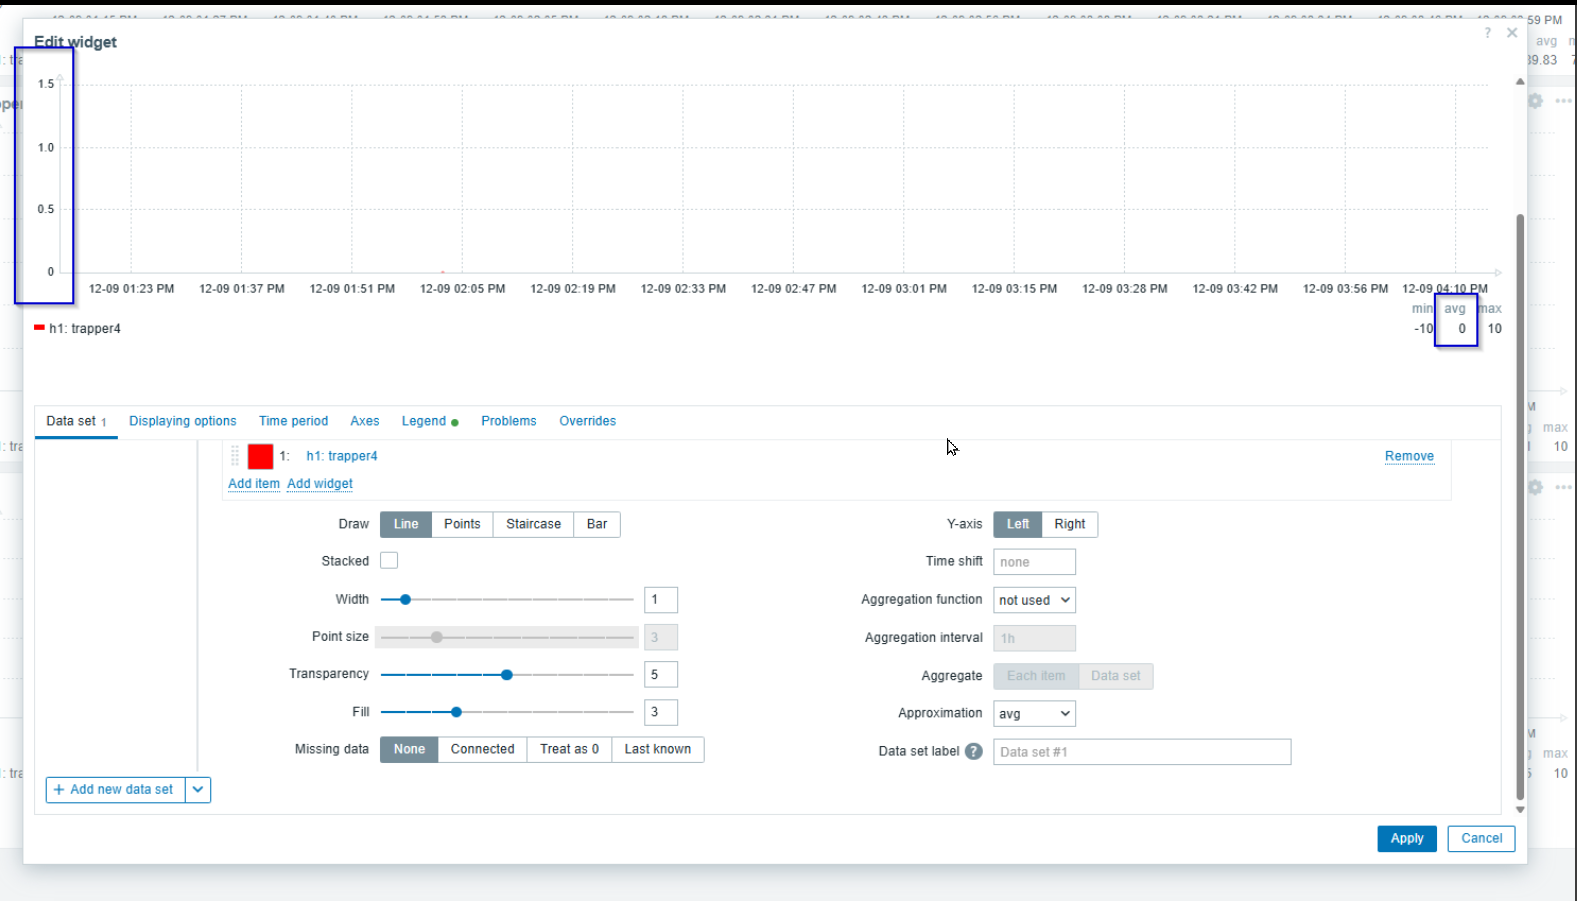
- Create graph widget. Add host and item as item list

- Go to Legend tab. Click on checkbox for "Display min/avg/max"
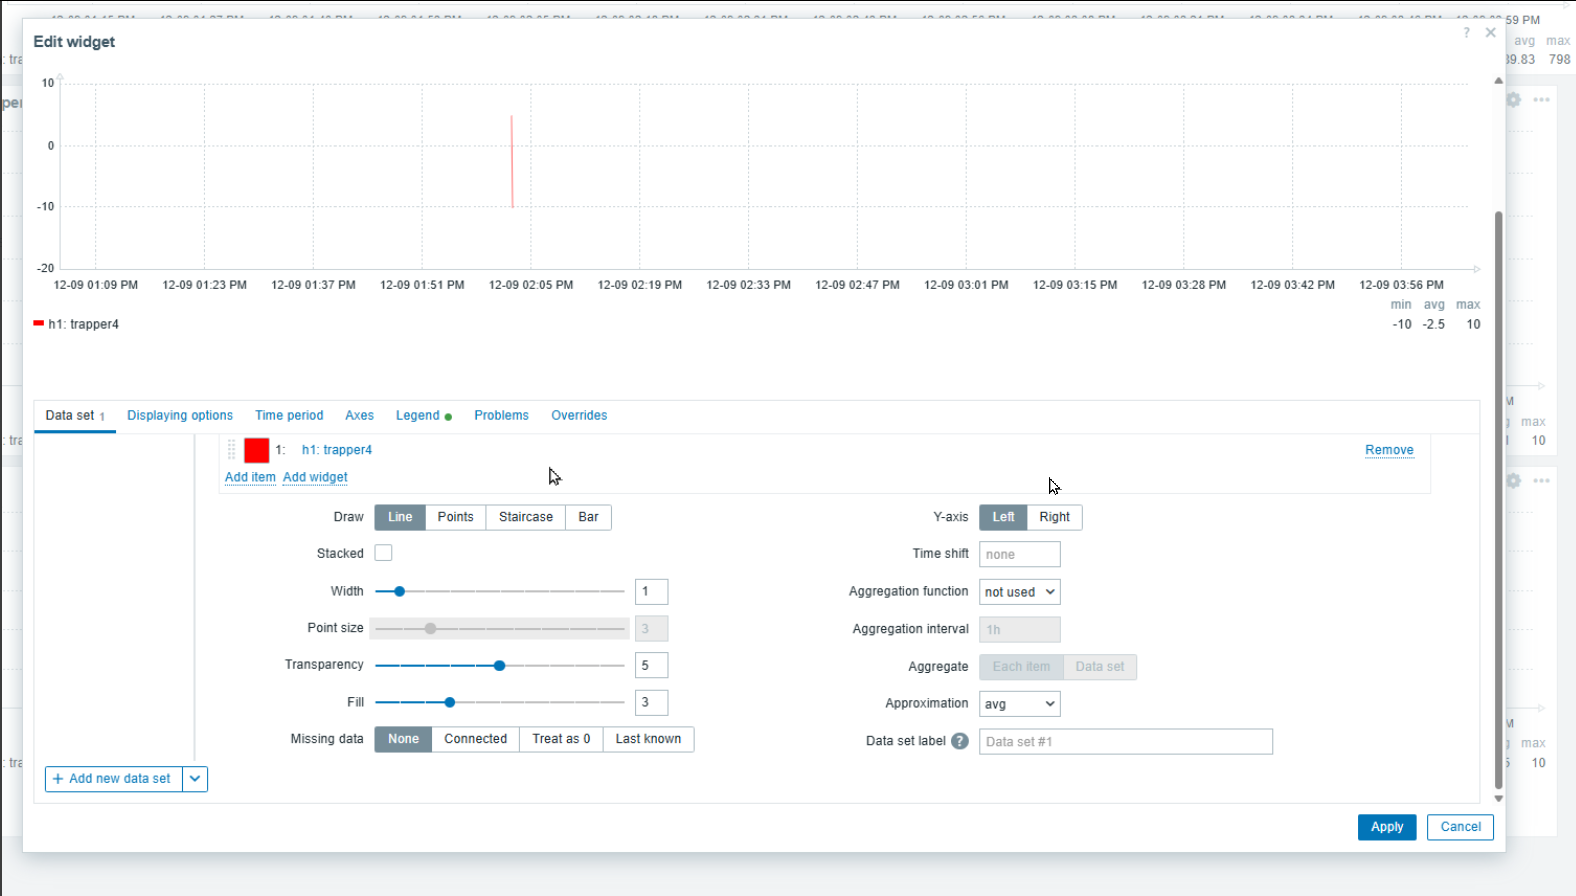
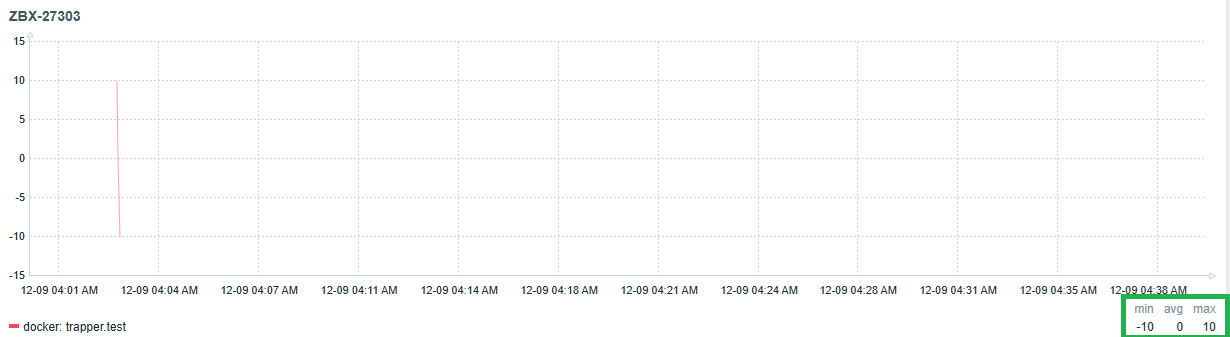
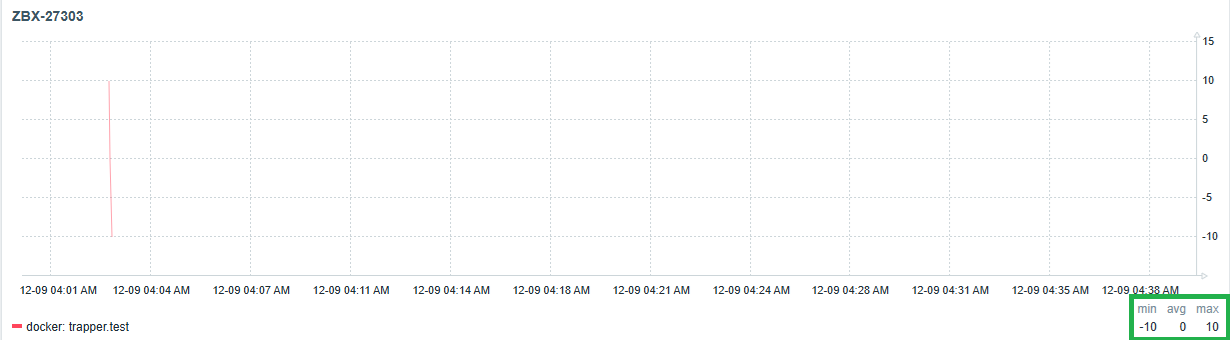
- In Data set tab change Y-axis from left to right


Actual:
- Different numbers are shown for Y-axis, when it is on the left / right side
- Different values are shown for legend avg
Screencast:
Expected:
Assume Y-axis position should not affect any numbers{}