-
Type:
Problem report
-
Resolution: Fixed
-
Priority:
 Major
Major
-
Affects Version/s: 7.0.28rc1, 7.4.12rc1, 8.0.0beta2
-
Component/s: Frontend (F)
-
Environment:7.4.10, nginx, ubuntu24
-
S26-W24/25, S26-W36/37
-
1
hello,
to reproduce:
1. prepare any latest GA zabbix, with some of collected metrics in DB,
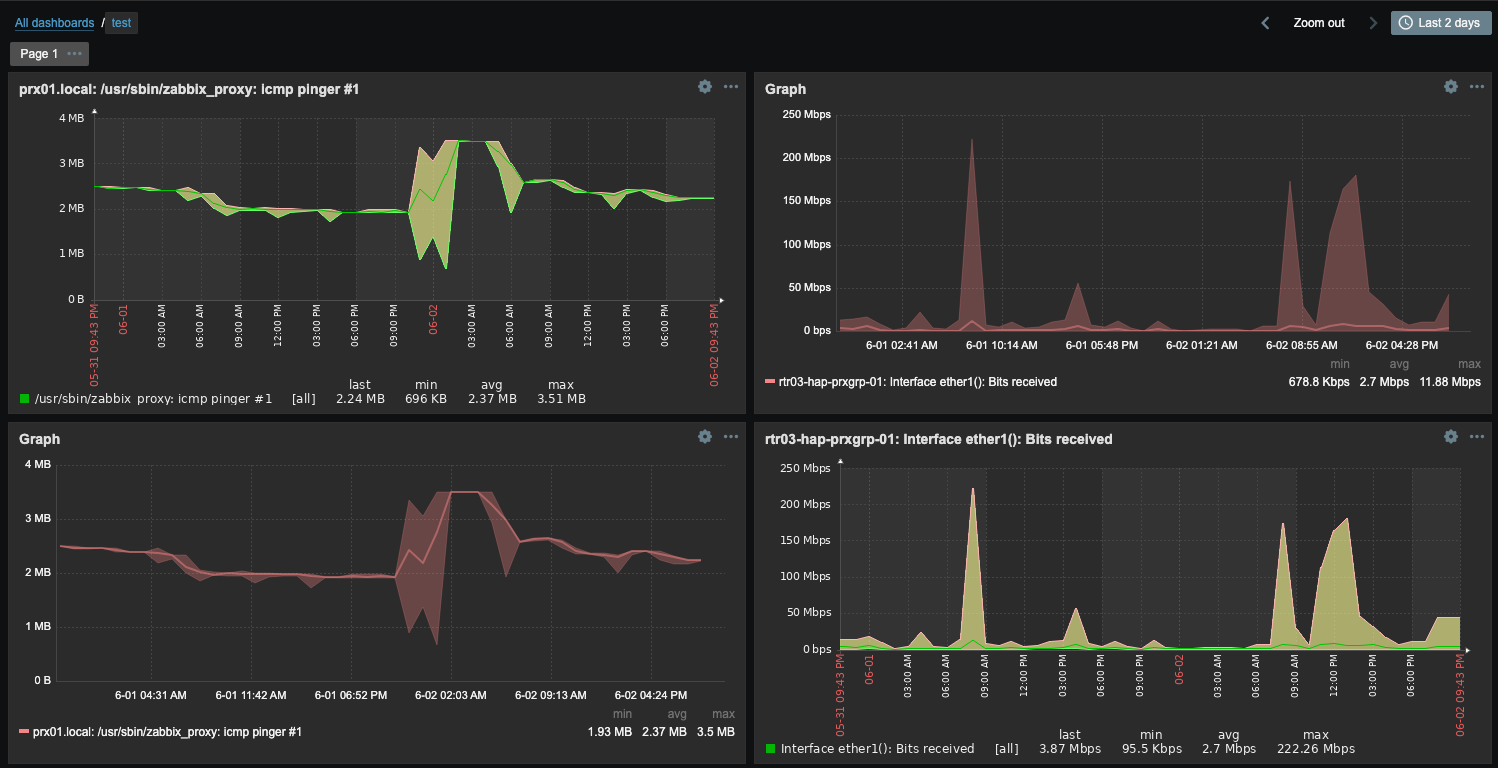
2. configure dashboard with 4 graphs: two classic, two "new" - in my case i used agent item, and snmp item
3. classic graph should be configured like: refresh 1min, source: simple graph, time period: dashboard, show legend: yes
4. "new" graph should be confiugred: in data set, select "Approxmination: all", select "aggregation function: not used". then, go to "legend", and mark checkbox near "display min/avg/max"
5. set time filter to "last X days" (to use trends)
in a result (example attached), on classic graph, for "max" value i have "3.51 MB",
but on "new" graph i have "3.5 MB",
for snmp item difference is much bigger, "11.88 Mbps" vs "222.26 Mbps",
why it's like that?