-
Type:
Problem report
-
Resolution: Unresolved
-
Priority:
 Trivial
-
None
-
Affects Version/s: 7.0.26
-
Component/s: Frontend (F)
-
None
-
Support backlog
Steps to reproduce:
- Go to monitoring/hosts
- select "Graphs" from a host
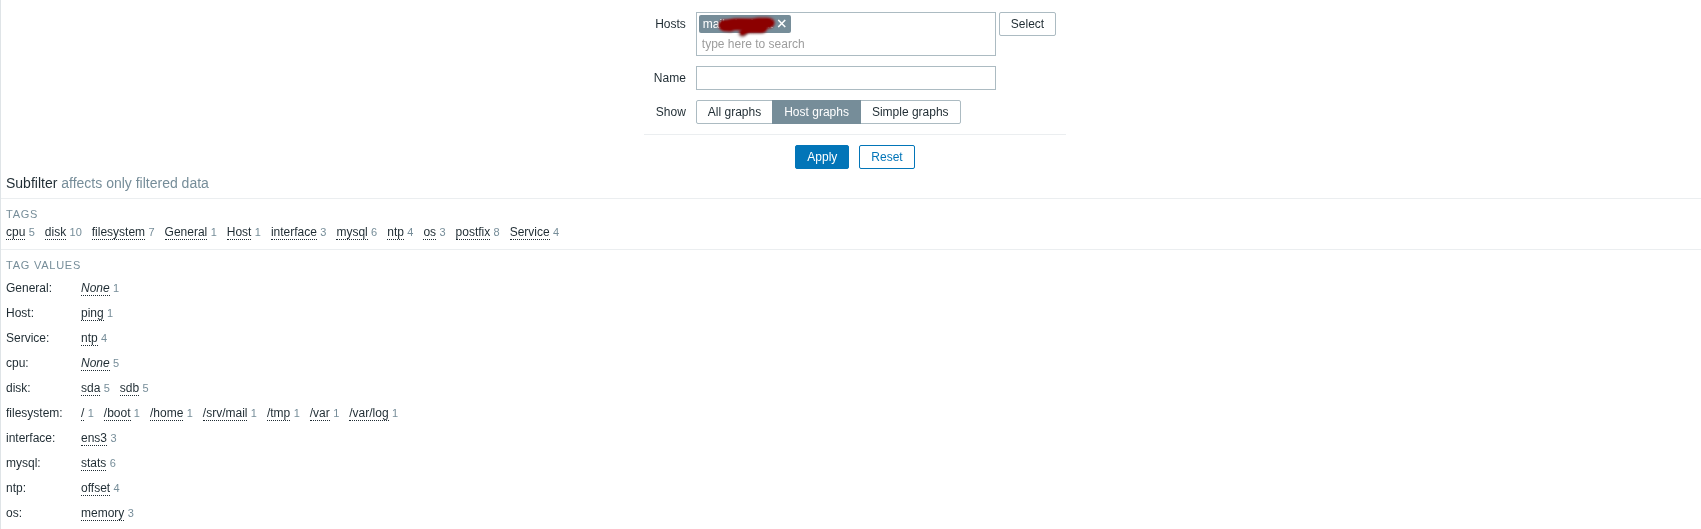
- all graphs of the selected host are displayed (screen1.png)
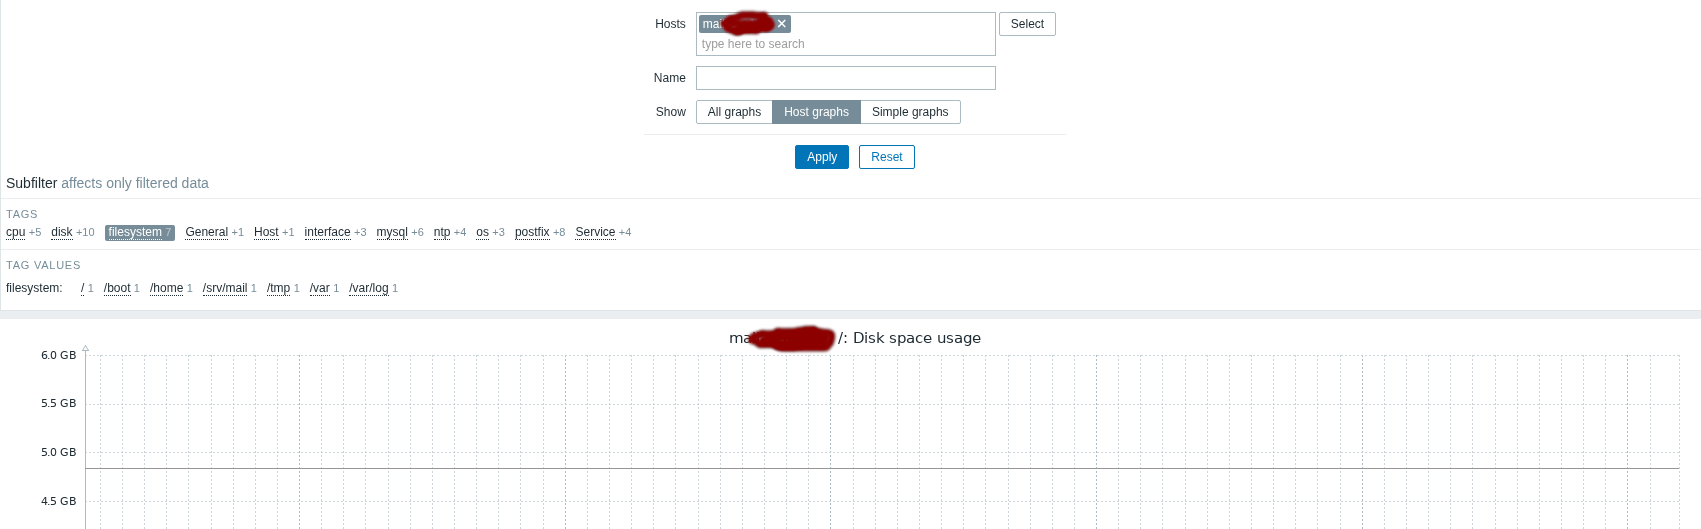
- filter on tag "filesystem"
- all graphs with tag "filesystem" are displayed (screen2.png)
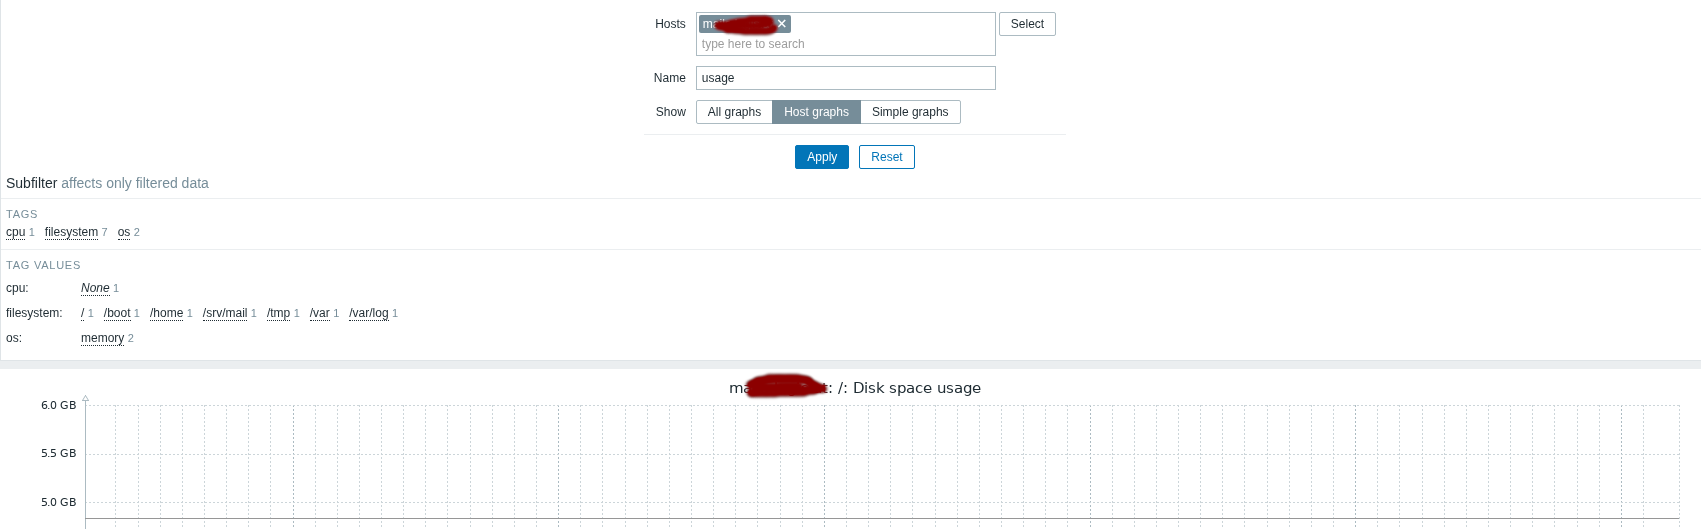
- add "usage" to the name filter and press apply
- page reloads and all graphs are displayed which containing usage because the selected filter tag "filesystem" is removed. (screen3.png)
This behaviour was seen after patch ZBX-25930.
Expected:
- click on apply button should not delete the selected filter tags.