-
Type:
Incident report
-
Resolution: Won't fix
-
Priority:
 Major
Major
-
None
-
Affects Version/s: 1.8.3
-
Component/s: Frontend (F)
-
None
-
Environment:CentOS 5.5 64-bit, MySQL 5.1.50 64-bit, PHP 5.2.12
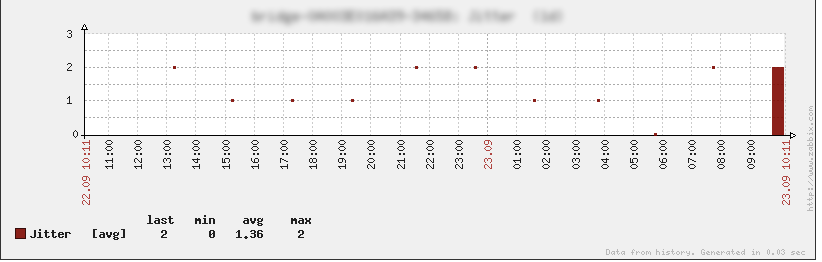
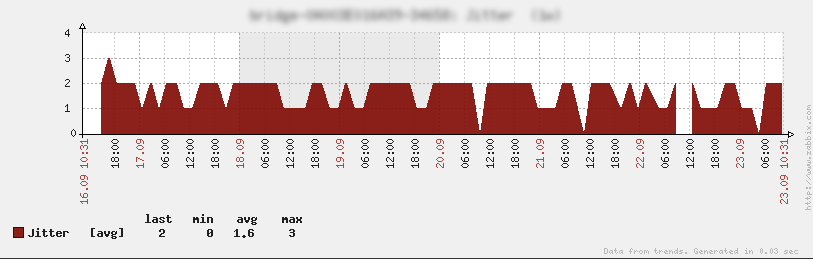
After upgrading to 1.8.3, some graphs display as individual dots instead of a solid graph. See screenshots.
It only happens at certain zoom levels. For example, it looks normal at 1 week but if I zoom in to 1 day it displays the problem. A forum thread suggested increasing the number of pre-fork pollers, but even at 100 pollers I still have the issue.
The server is monitoring 27463 hosts and 247882 items (not a typo ![]()
The buggy screenshot is at 1d zoom level, the normal screenshot is at 1w. I blurred the graph title out for confidentiality reasons.