-
Type:
Incident report
-
Resolution: Duplicate
-
Priority:
 Major
Major
-
None
-
Affects Version/s: 1.8.4rc2
-
Component/s: Frontend (F)
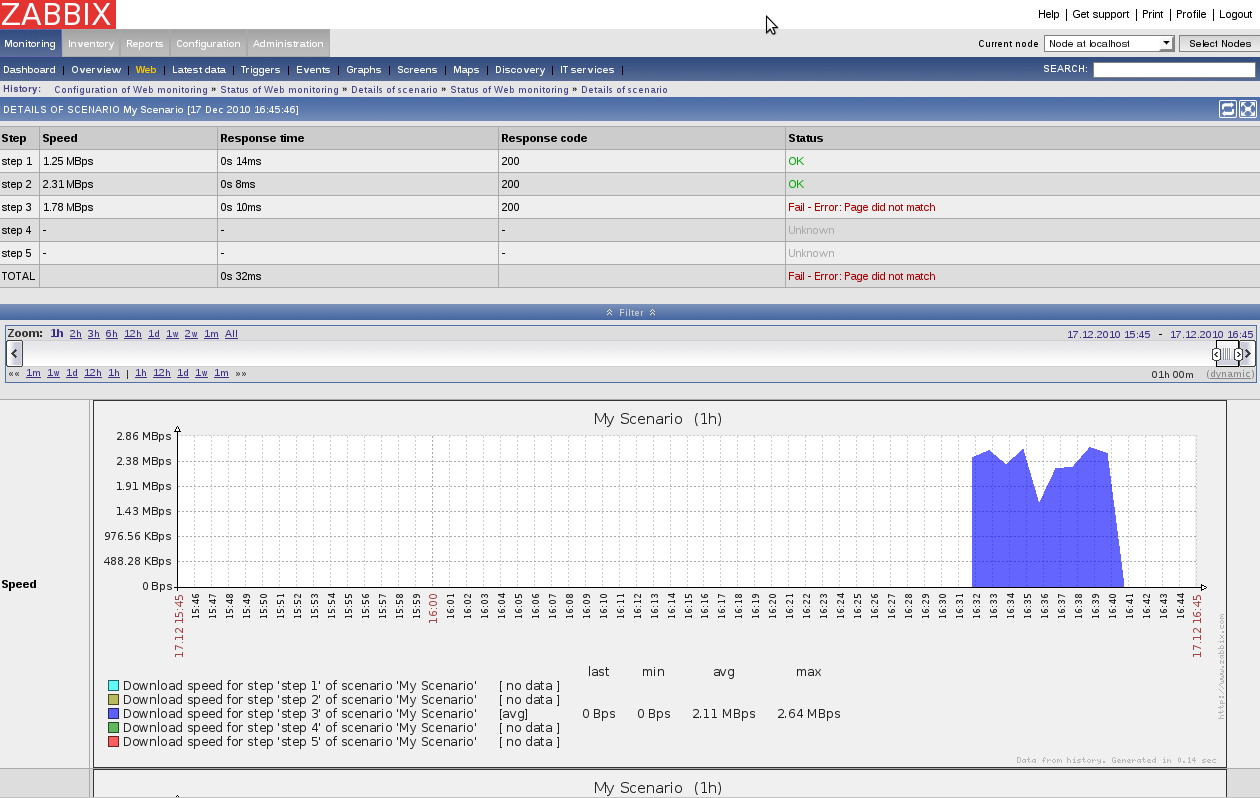
There is something terribly wrong with Web monitoring graphs.
For instance, "My Scenario" used to fail at step 3 out of 5. The graphs for that period looked like failed-step-only.png. Only data for the failed step was shown.
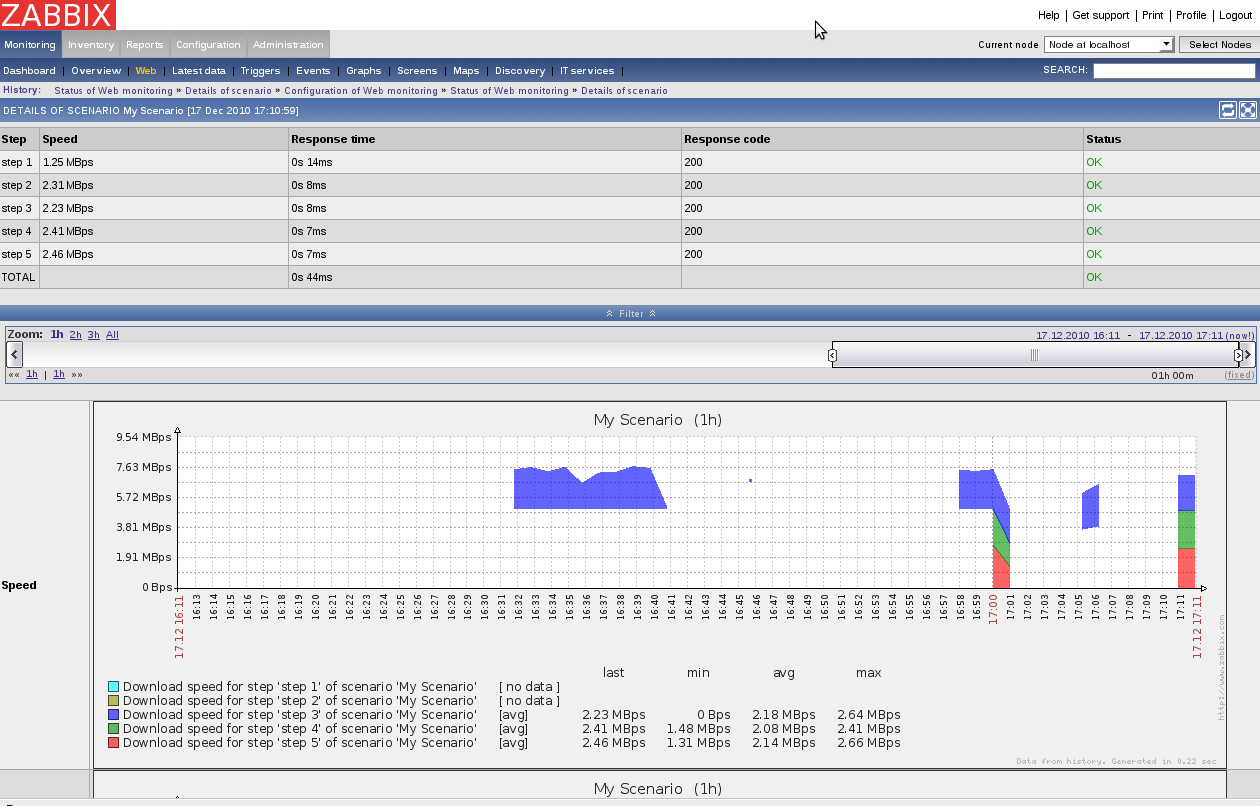
Then, "My Scenario" started to work well, but the graphs started looking like last-three-steps.png. The data is only shown for the last three steps.
- is duplicated by
-
-

- Closed
-