Graphs doesn't draw the value_max and value_min lines when item is a Gradient Line and function is All

XMLWordPrintable

    • Type: Incident report
    • Resolution: Won't fix
    • Priority: Major
    • None
    • Affects Version/s: 1.8.5, 1.8.6, 1.8.7, 1.9.5 (alpha), 1.9.6 (beta)
    • Component/s: API (A), Frontend (F)

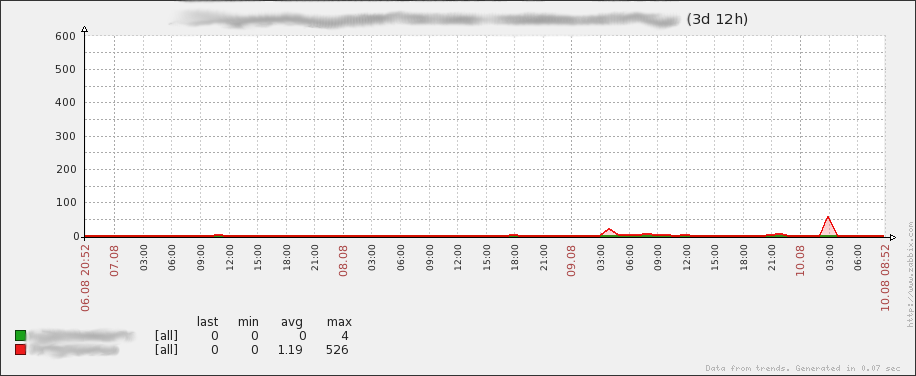
      When items is configured like Gradient Line and function like All, graphs doesn't show the value_max and value_min.

      Image chart2-gradientline-bug.png - Look at max of red (Where is the 526 in graph?)
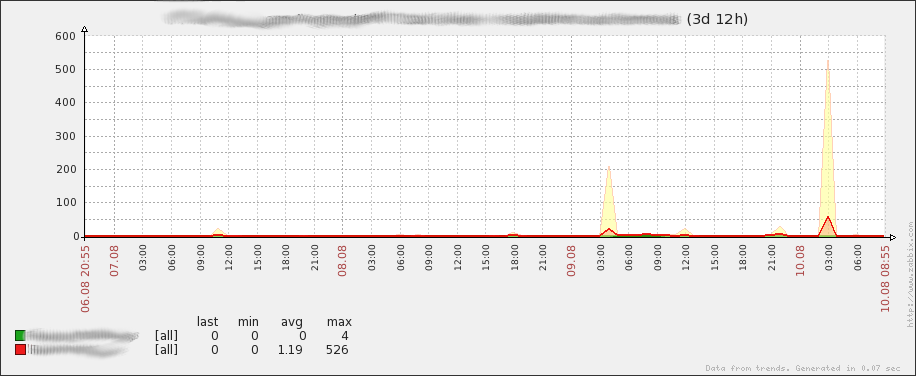
      Image chart2-gradientline-patch.png - class.cchart.php patched

        1. chart2-gradientline-bug.png
          27 kB
          Ricardo Santos
        2. chart2-gradientline-patched.png
          31 kB
          Ricardo Santos
        3. class.cchart.php-gradientline-all.patch
          0.7 kB
          Ricardo Santos

            Assignee:
            Unassigned
            Reporter:
            Ricardo Santos
            Votes:
            0 Vote for this issue
            Watchers:
            1 Start watching this issue

              Created:
              Updated:
              Resolved: