-
Type:
Incident report
-
Resolution: Fixed
-
Priority:
Major
-
Affects Version/s: 1.8.8
-
Component/s: Server (S)
-
Environment:high loaded zabbix_server with the big count of actions & operations configured and events flow
Starting from 1.8.9 a default message was extended in the ZBX-2493.
But that is not a reason of creation this issue report currently.
Starting from ZBX-2493 this small problem will be more noticeable than before, because currently server has to expand even more macros.
default message body (longdata) for operation, which is stored in the DB (after ZBX-2493):
<<<<
Trigger:
Trigger status: {TRIGGER.STATUS}
Trigger severity: {TRIGGER.SEVERITY}
Trigger URL: {TRIGGER.URL}
Item values:
1. {ITEM.NAME1} ({HOSTNAME1}:{TRIGGER.KEY1}): {ITEM.VALUE1}
2. {ITEM.NAME2} ({HOSTNAME2}:{TRIGGER.KEY2}): {ITEM.VALUE2}
3. {ITEM.NAME3} ({HOSTNAME3}:{TRIGGER.KEY3}): {ITEM.VALUE3}
>>>>
Previosly was only:
<<<<{TRIGGER.NAME}
:
{TRIGGER.STATUS}Last value:
{ITEM.LASTVALUE} {TRIGGER.URL}>>>>
When server executes "execute_operations()" function it expands macros from the shortdata & longdata **of the operation** disregarding that the operation is configured with the "Default message" enabled.
So server spends extra time doing unnecessary work on this step.
I suggest the patch.
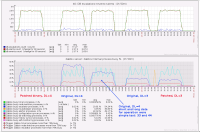
I performed several experiment (with the original binary and the patched one).
I sent some values to an item with the high speed ~ 2500 per minute. Trigger was in the multiple PROBLEM generation mode.
So I generated ~2500 alerts per minutes.
I understand that server's extra work can be noticeable only in the similar experiments, but I think this server behavior still should be improved.
Question - what is the difference in performance?
Answer ~ for 3-4% less load for escalator process
With the DebugLog=4 the load is less for ~16% and there are no annoying lines in the debuglog.
See detailed pictures.
Please, consider issue ZBX-4340 too when perform this one.

