-
Type:
Incident report
-
Resolution: Won't fix
-
Priority:
 Minor
Minor
-
None
-
Affects Version/s: 1.8.8
-
Component/s: Server (S)
-
Environment:Debian 6.0.3
mysql Ver 14.14 Distrib 5.1.49, for debian-linux-gnu (x86_64) using readline 6.1
dedicated DB for testing, located at the raid0 600GB/7200 rpm
Hard macros list:
{TRIGGER.EVENTS.UNACK}
{TRIGGER.EVENTS.PROBLEM.UNACK}
{TRIGGER.EVENTS.ACK}
{TRIGGER.EVENTS.PROBLEM.ACK}
Action's settings, configured macros:
{EVENT.ID}
{TRIGGER.EVENTS.UNACK}
{TRIGGER.EVENTS.PROBLEM.UNACK}
{TRIGGER.EVENTS.ACK}
{TRIGGER.EVENTS.PROBLEM.ACK}
Current count of events (not so big, btw):
mysql> select count(*) from events;
330984
Results: see filtered out only informative lines "events_is_not_empty.txt"
Here is small part from log:
 24058:20111116:112224.185 In process_escalations()
 24058:20111116:112224.189 In substitute_simple_macros() data:'{EVENT.ID}
 24058:20111116:112224.189 query [txnlev:1] [select count(*) from events where object=0 and objectid=13141 and value in (1,0) and acknowledged=0]
 24058:20111116:112224.513 query [txnlev:1] [select count(*) from events where object=0 and objectid=13141 and value in (1) and acknowledged=0]
 24058:20111116:112224.826 query [txnlev:1] [select count(*) from events where object=0 and objectid=13141 and value in (1,0) and acknowledged=1]
 24058:20111116:112225.137 query [txnlev:1] [select count(*) from events where object=0 and objectid=13141 and value in (1) and acknowledged=1]
 24058:20111116:112225.453 escalator #1 spent 1.267491 seconds while processing escalations
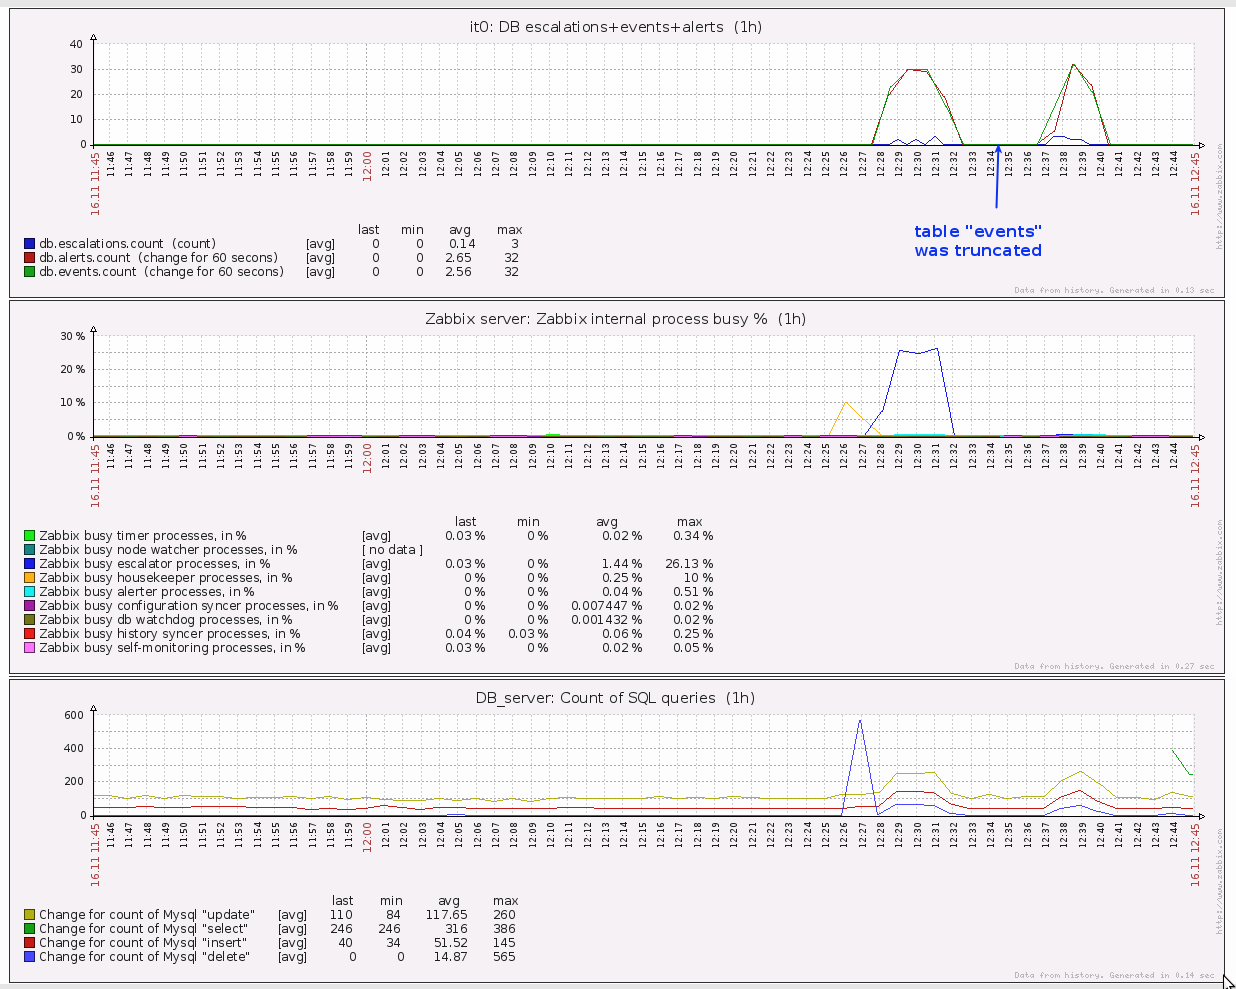
Conclusion: every time when escalator process is working and only for first event, it spends to much time to expand mentioned macros.
Table "events" was truncated at 12:35 and the experiment is performed again.
Results: see "events_is_empty.txt" filtered out lines too.
No delays, and escalator process doesn't loaded.
Both stages you can see at the attached picture.
Possible solution (IMO): creation of additional index.
added note: at the attached picture in the graph "Count of SQL queries" the changes are counted in interval of 1 minute.