-
Type:
Incident report
-
Resolution: Cannot Reproduce
-
Priority:
 Blocker
-
None
-
Affects Version/s: 1.8.10
-
Component/s: Server (S)
-
Environment:OS: CentOS release 5.5 (Final)
Zabbix server 1.8.10 (revision 24303)
net-snmp version 5.7.1
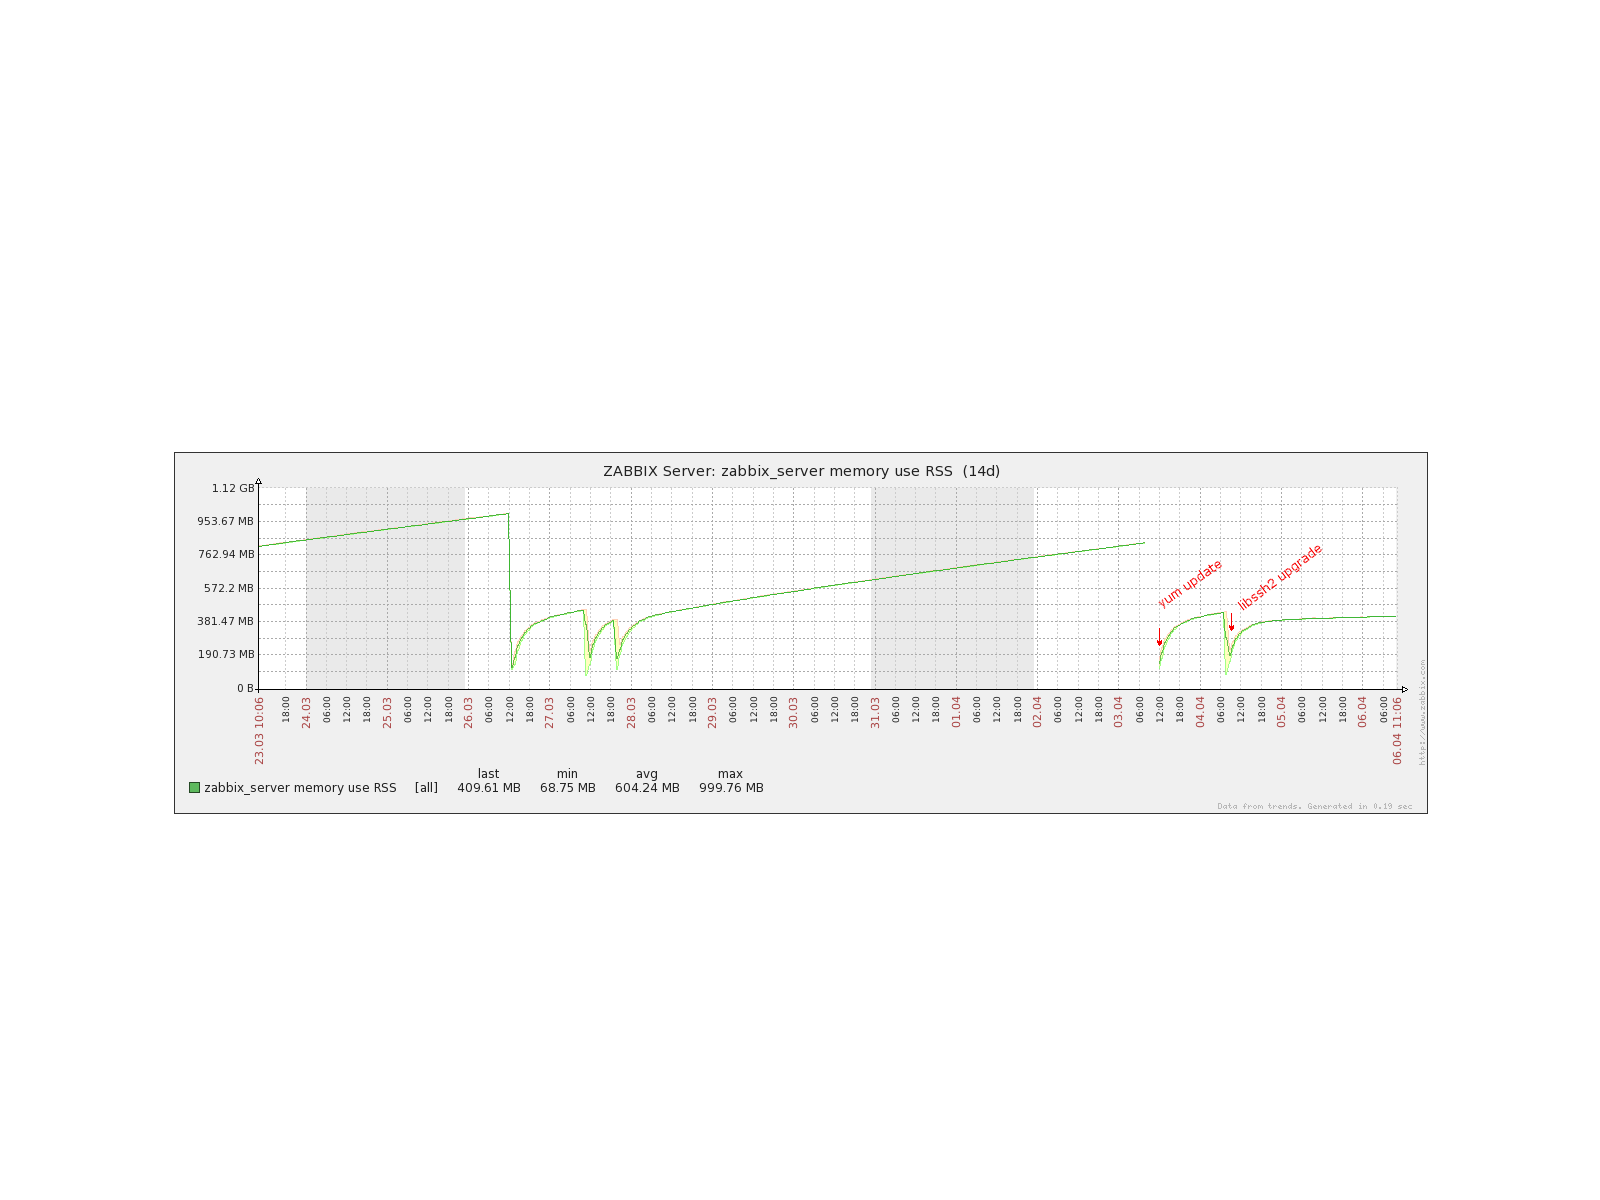
We have issue with memory allocation of zabbix_server poller processes.
Server is configured to start 5 pollers. Memory utilization is constantly growing and for 10 days
it reach over 1GB. History graph is attached. Once it goes over 1GB, we are restarting zabbix_server (drop visible in graph).
Without restart, usage grows until OS runs out of memory and start swapping heavily.
Version info:
Zabbix server 1.8.10 (revision 24303), OS: CentOS release 5.5 (Final), net-snmp version 5.7.1
History graph, ps -aux output, and server config attached. Detailed information in the file "zabbix_server_mem.txt"
Attached output of these commands:
- for i in 7320 7321 7322 7323 7324 ; do pmap -d $i; echo; done > pollers_pmap_d.txt
- for i in 7320 7321 7322 7323 7324 ; do pmap -x $i; echo; done > pollers_pmap_x.txt
- for i in 7320 7321 7322 7323 7324 ; do pmap $i; echo; done > pollers_pmap.txt
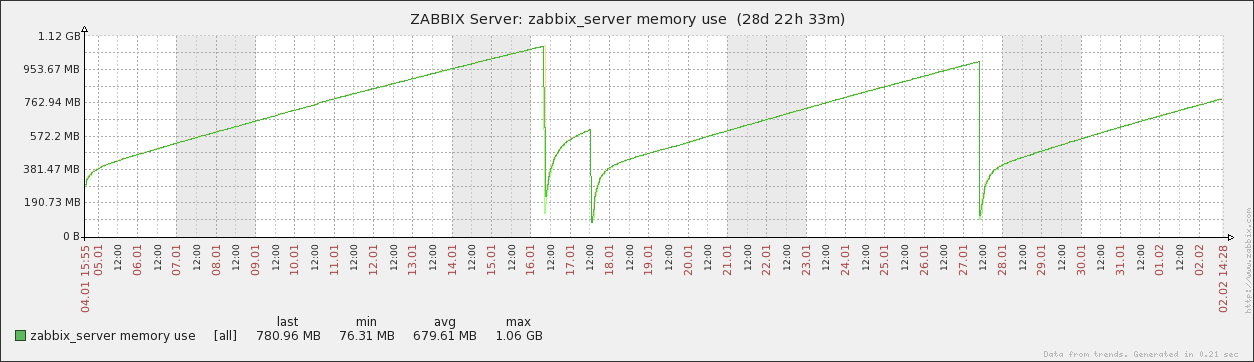
Memory leak is monitored since begining of January, but I believe it was there for couple of months before causing performance issues.
I cannot relate it to zabbix upgrades.
Two weeks ago, zabbix server config is changed, cache size is reduced from 768M to 256M, but that didn't change memory utilization.
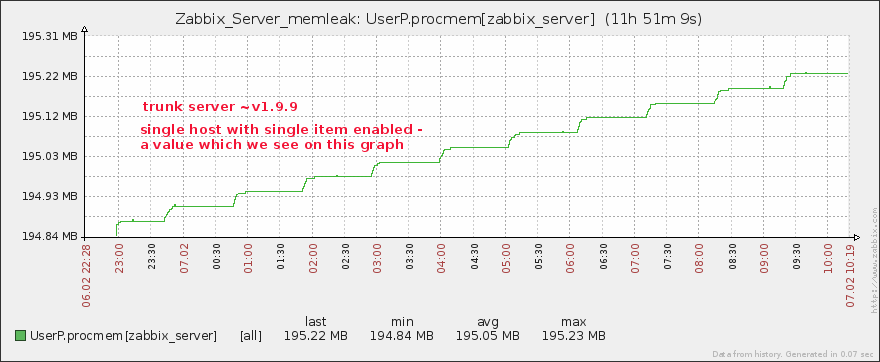
Received sum RSS size is multiplied by 1024 in item configuration (item definition attached)
Maximum value for this item in hystory is 1GB, because we use monit to restart zabbix server once it reach 1GB.
Before January, server had 2GB RAM so 1GB for zabbix_server was a lot (this box is running mysql and apache frontend also).
Now we have 4GB RAM (3546 MB reported by OS, 32 bit), I will disable automatic restart and monitor it manually.


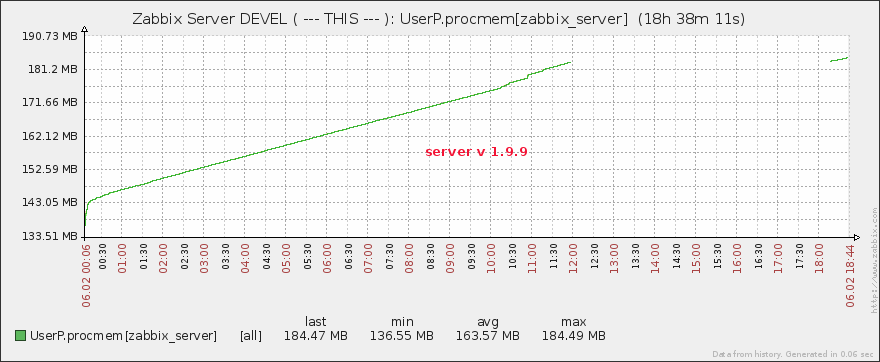
![UserP.procmem[zabbix_server].gif](/secure/attachment/17978/UserP.procmem%5Bzabbix_server%5D.gif)