-
Type:
Incident report
-
Resolution: Incomplete
-
Priority:
Critical
-
None
-
Affects Version/s: 2.1.0
-
Component/s: Frontend (F), Server (S)
First of all, it could be my mistake, I could have misconfigured my setup, but I have rechecked everything, so please forgive me if I'm wrong.
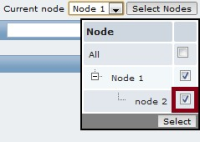
After setting up distributed monitoring (DM) and starting nodes, there are no any errors in Zabbix server log on both master and slave nodes. There are plenty of records about sending and receiving history, events, audit, configuration data on both nodes. However slave node is not shown in frontend on master node, neither in the Current node drop-down list, nor I can see any hosts, monitored by the slave node, in the master node's frontend. The above mentioned drop-down list contains only two items: All and master node.
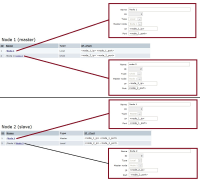
Second, I have noticed that on the slave node in Administration -> DM, in the (local) slave node setup master node for node "slave" is node "slave" itself, see dm3.png screenshot.
- is duplicated by
-
ZBX-5156 Incorrect info in node form
-
- Closed
-


