graph legend shows min/max for data that is not plotted

XMLWordPrintable

    • Type: Incident report
    • Resolution: Unresolved
    • Priority: Trivial
    • None
    • Affects Version/s: 2.0.9
    • Component/s: Frontend (F)
    • Environment:
      CentOS 6

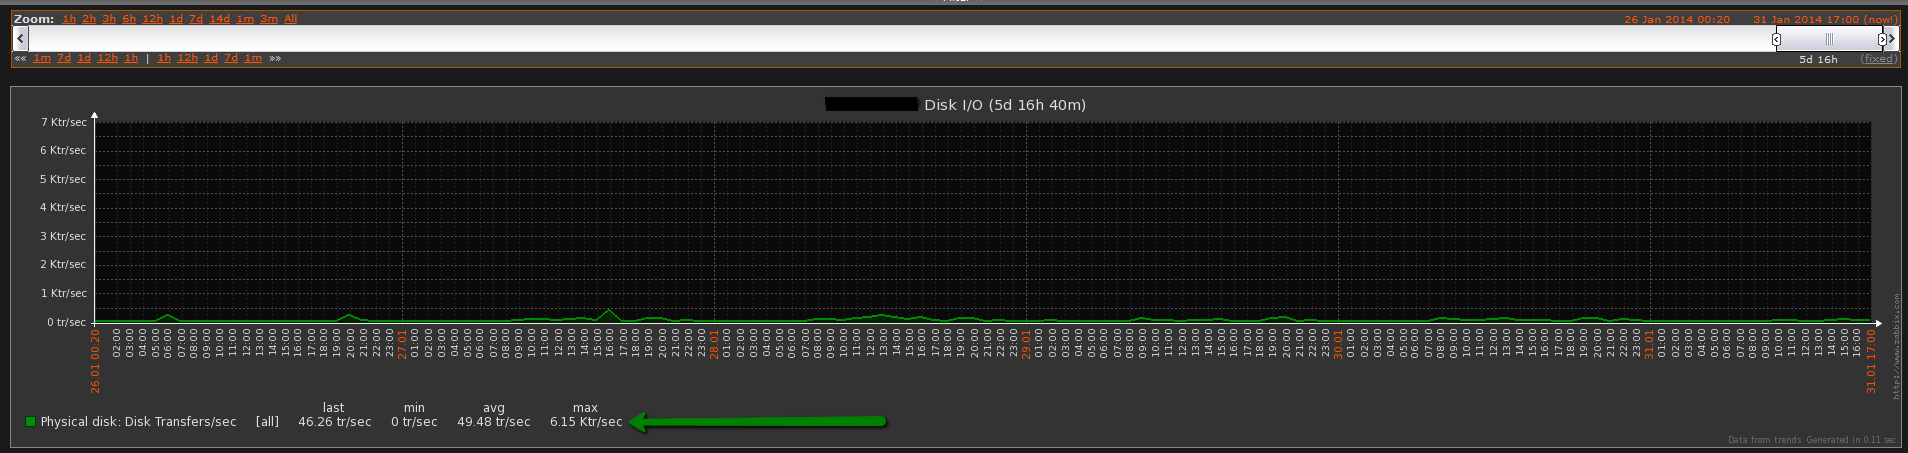
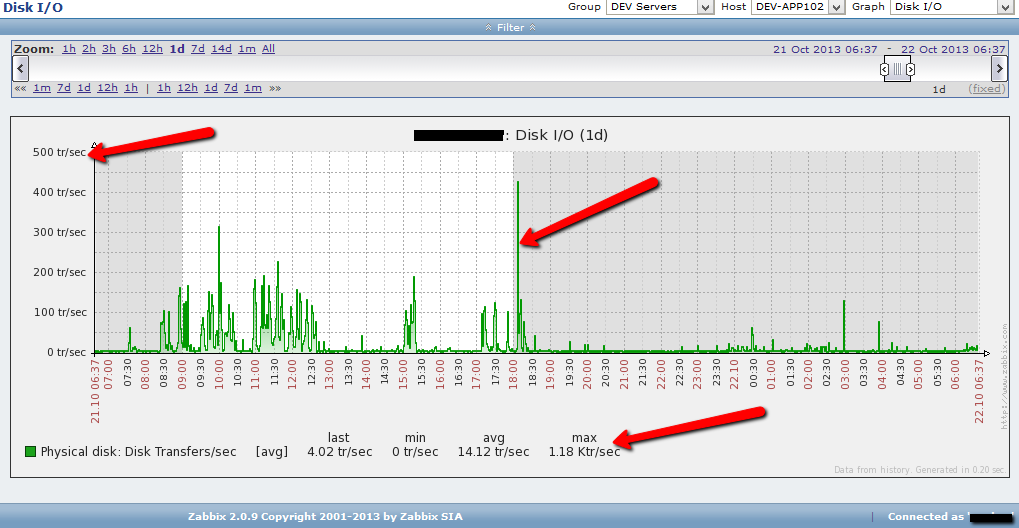
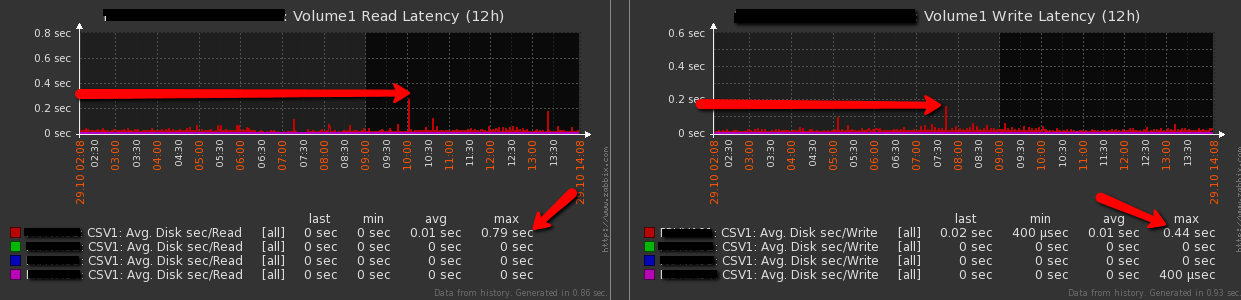
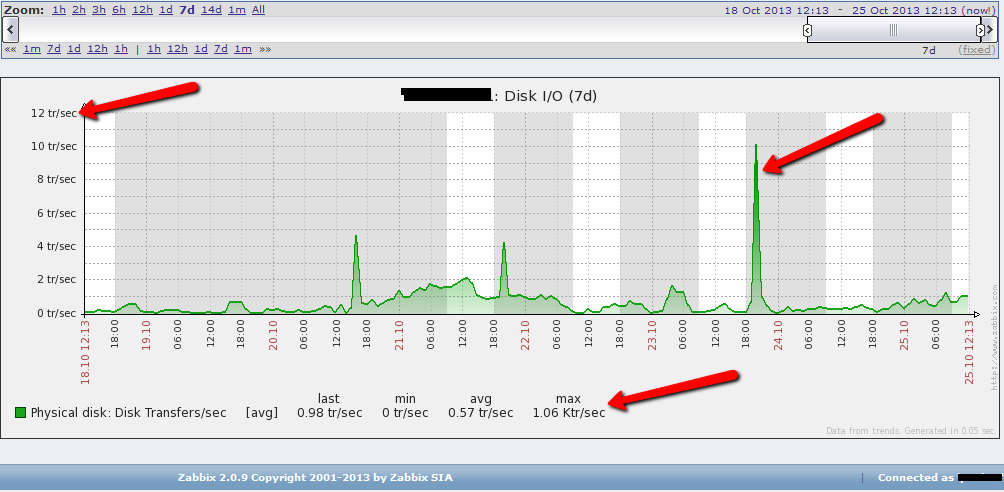
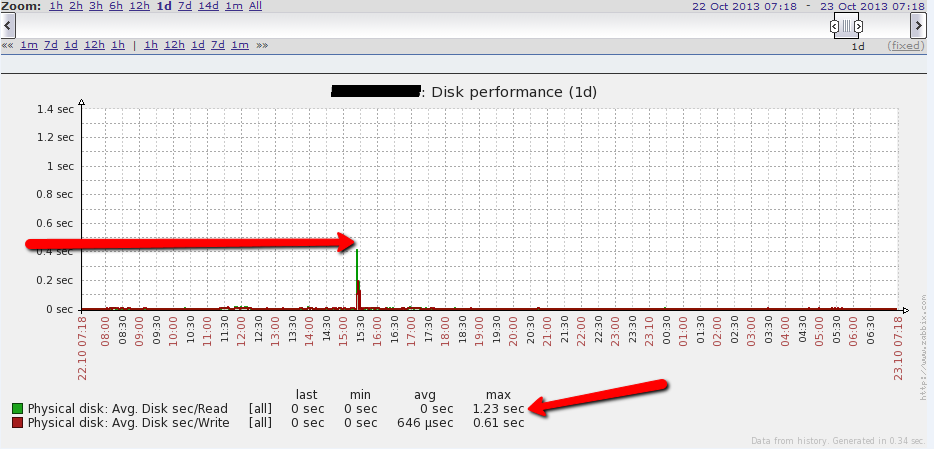
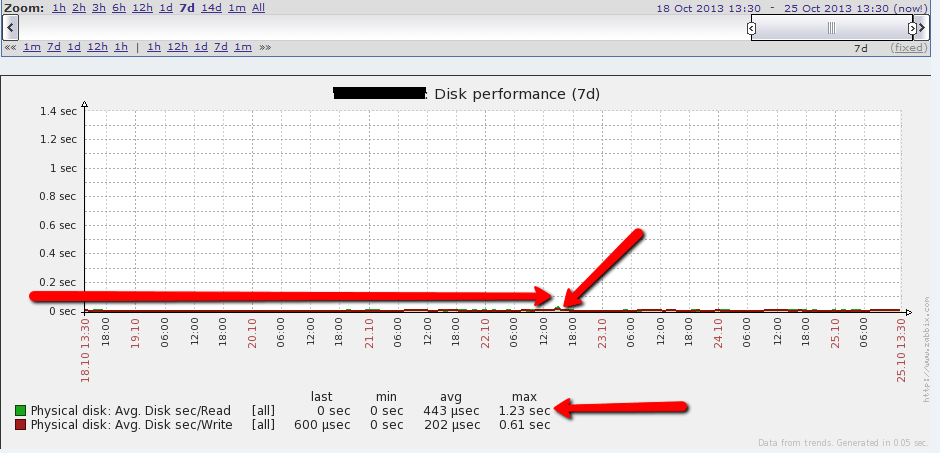
      Graphs get scaled inaccurately thus misleading Zabbix users/administrators and rendering this functionality useless. Actual and maximal values don't get displayed on graph - not aligned with graph scale.

      When zoomed in to a few hour interval everything is displayed correctly. Problem is with a bigger picture (1d; 7d) - see attached screenshots.

        1. 2014-01-31_1701.png
          2014-01-31_1701.png
          42 kB
        2. zabbix_209_graph_bug_2.png
          zabbix_209_graph_bug_2.png
          58 kB
        3. zabbix_209_graph_bug_5.png
          zabbix_209_graph_bug_5.png
          45 kB
        4. zabbix_209_graph_bug.png
          zabbix_209_graph_bug.png
          53 kB
        5. zabbix_209_graph_bug3.png
          zabbix_209_graph_bug3.png
          39 kB
        6. zabbix_209_graph_bug4.png
          zabbix_209_graph_bug4.png
          40 kB

            Assignee:
            Unassigned
            Reporter:
            Peteris
            Votes:
            3 Vote for this issue
            Watchers:
            4 Start watching this issue

              Created:
              Updated: