-
Type:
Incident report
-
Resolution: Unsupported version
-
Priority:
Trivial
-
None
-
Affects Version/s: 2.2.0
-
Component/s: Frontend (F)
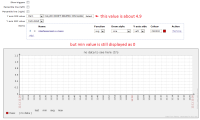
After ZBX-7272 fix, graphs no longer show many gray lines and plain zero on Y axis if no there is data. For Y axis min value when it's value fixed, graph shows that min value and works correctly. But when Y axis is set as item and there is a value (for example 4.9), graph shows min value 0. It should show that min value found on item. See attached image.
