-
Type:
Incident report
-
Resolution: Unsupported version
-
Priority:
 Trivial
-
None
-
Affects Version/s: 2.0.9
-
Component/s: Frontend (F)
-
Environment:CentOS 6.2 x64
PHP 5.2.17
MySQL 5.6.12
Database Storage: 4TB LUN on SAN with SSDs
As my production environment has become larger I have noticed a disturbing trend. The amount of time that it takes to link a host to templates seems to be a function of the number of items or triggers in the environment (most likely items).
As an example, I have a development environment with only around 600 items in which I can add templates to a single host in less than 1 second. My staging environment with about 18000 items responds the same. My production environment, however, is an entirely different story. I currently have 1,144,098 items in production. Every batch of servers that I link templates to gets slower and slower to do. When I had around 700,000 items it took 10 seconds to link templates to only 2 hosts. Now that I have over 1.1million items, it takes 20-22 seconds to link templates to 2 hosts. This is unusable at my scale because I routinely add 100+ hosts to my system. I fully expect that as I add more and more that it will become even slower to link templates.
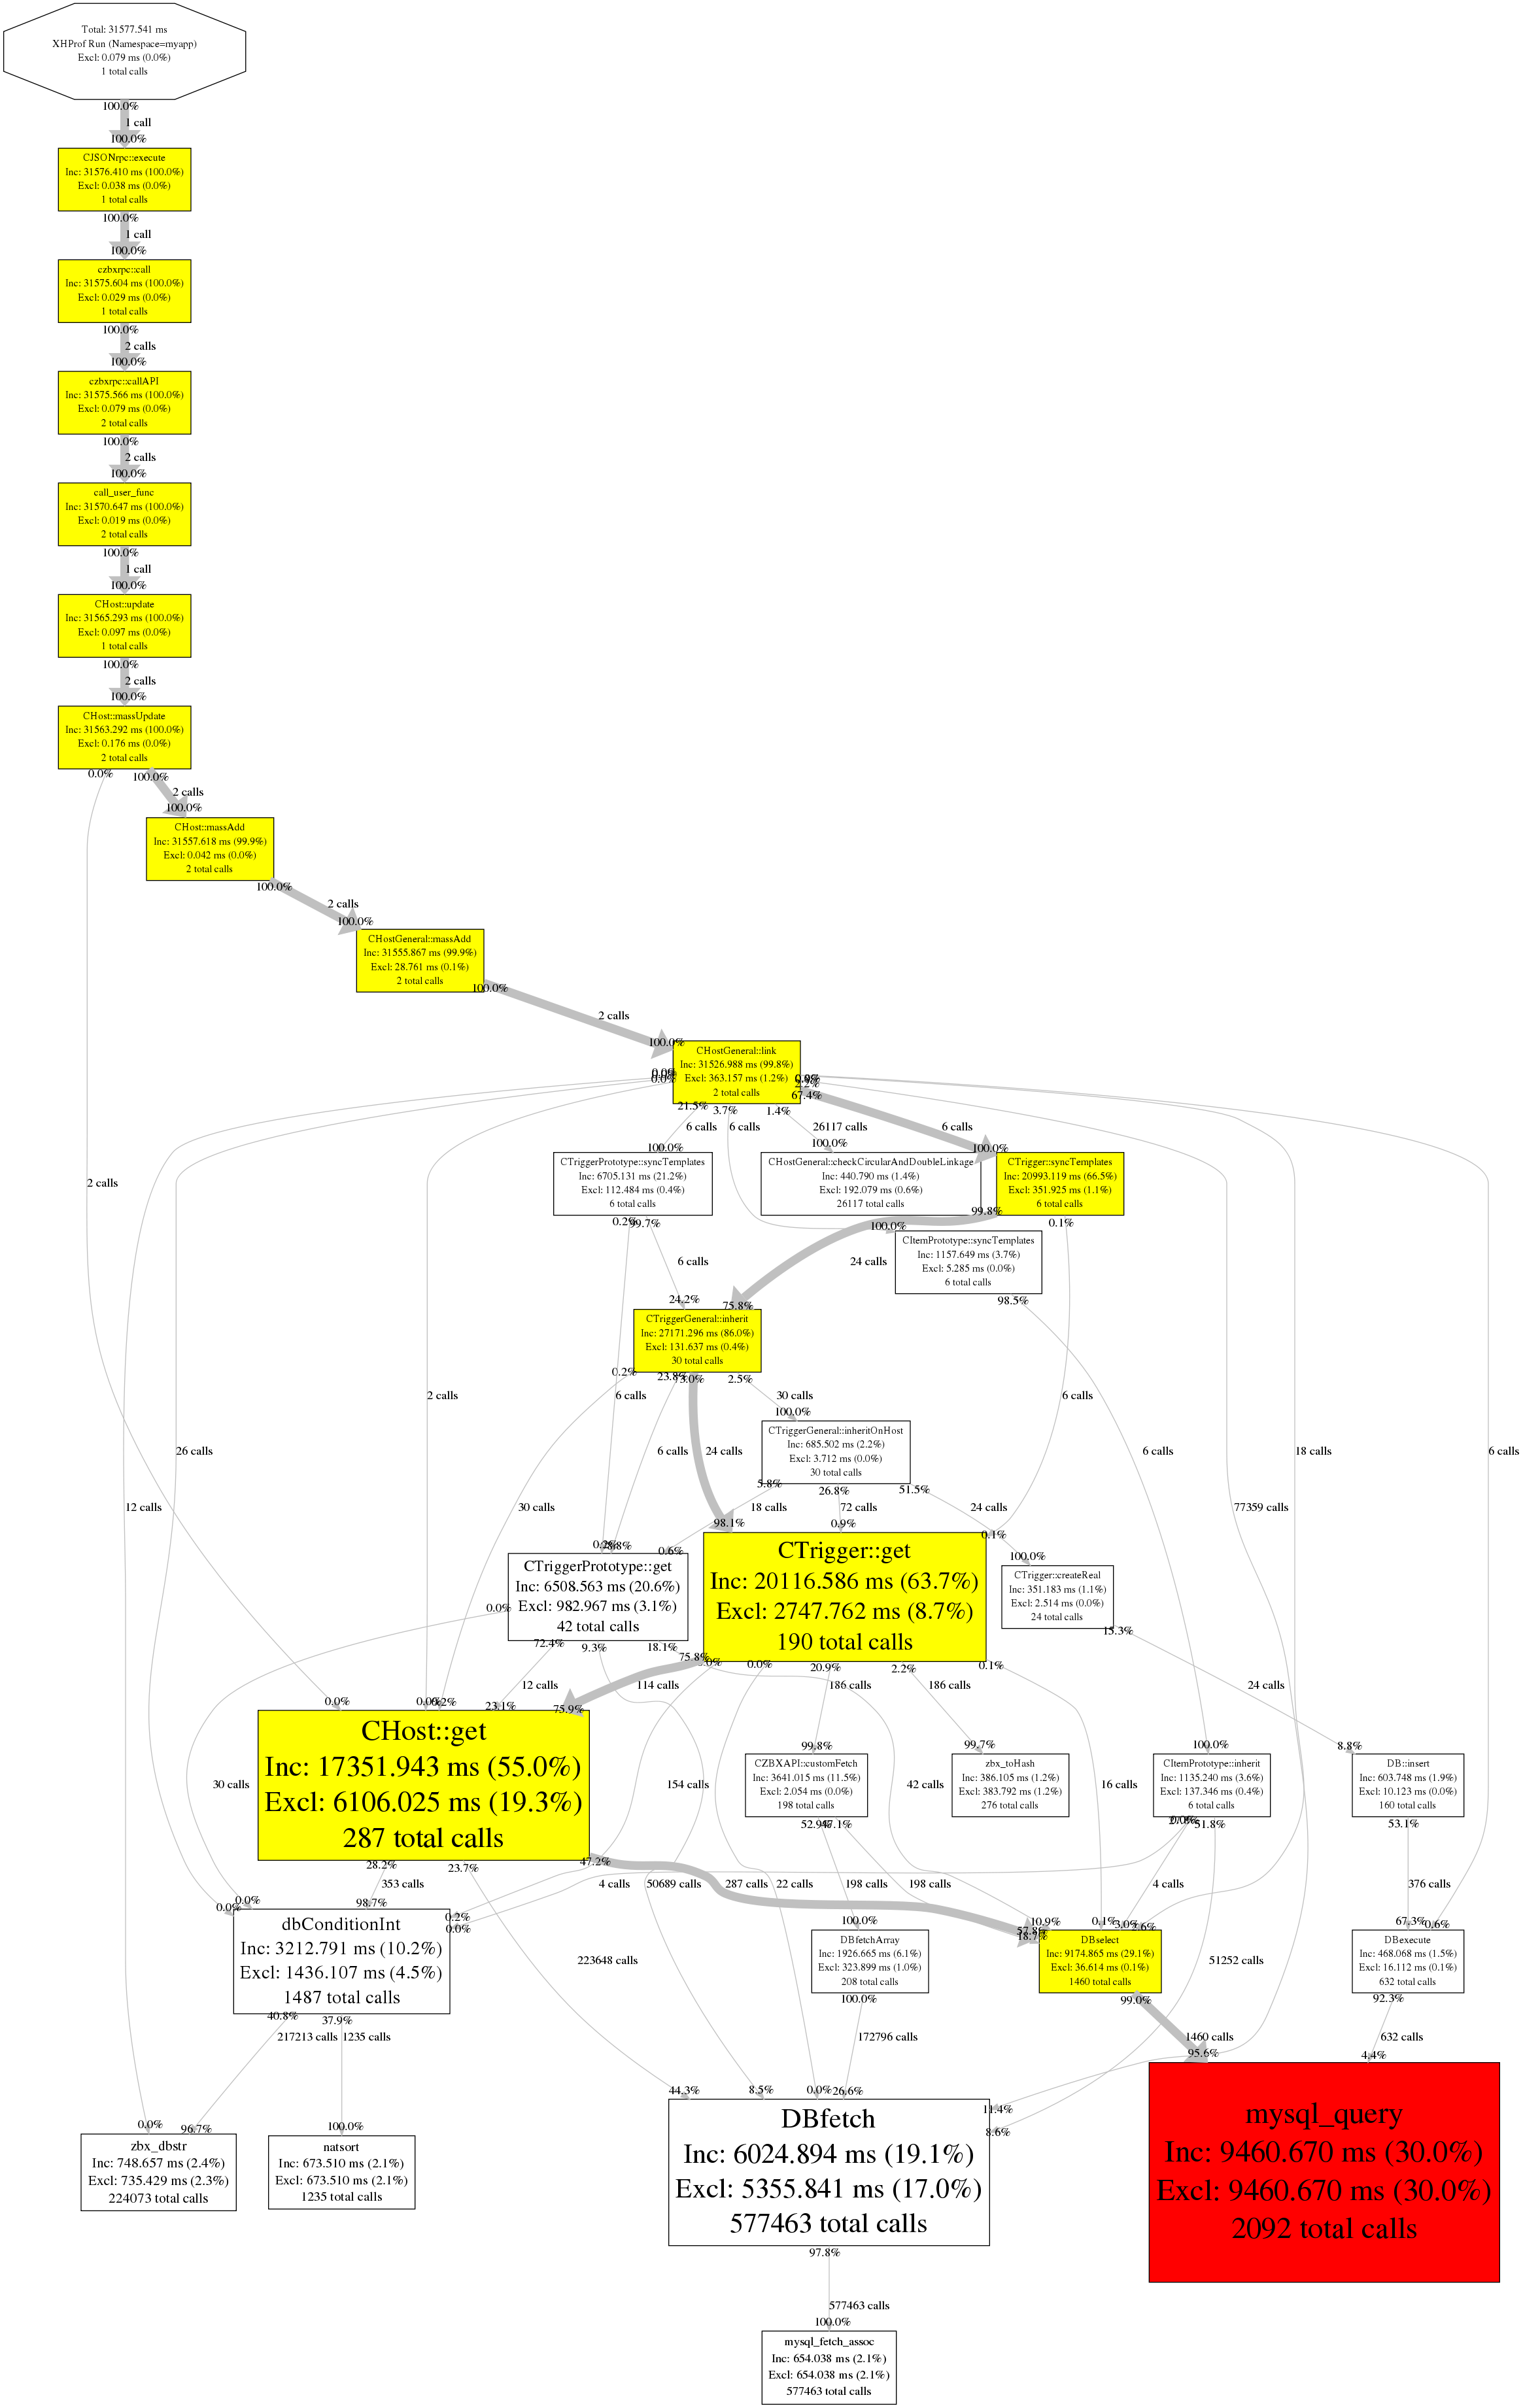
In my attempts to figure out what was going on I threw xhprof and enabled profiling for Zabbix when I was linking templates. The callgraph is attached. I couldn't believe my eyes when I saw how many times mysql_query was called: 2092 times! All those queries took 9.5 seconds alone to complete. Looking at all the data took another 5.36 seconds (DBfetch calls). There was almost 15 seconds right there.
I thought I better double check to be sure my DB server (which is backed by an SSD SAN) wasn't having problems. It's completely fine. No I/O issues, no CPU problems, memory looks great. In fact, almost all other parts of the UI are fairly responsive (other tickets have been opened or will be soon for other slow parts in a large environment). I then went ahead and enabled debug on the Zabbix UI for my user to see what queries are running. I did not have a single query that took longer than 0.3 seconds to run (and there were very few of those). Most of them only took up to 0.029 seconds. I guess running 2092 individual queries really just takes a long time (go figure!).
I have attached a saved version of the html page with all the debug info. The number of queries is nothing short of insanity. By examining the output, the longest query was 0.263 seconds. There are about 4 or 5 other queries like it and the query is ridiculously huge.
After that there are 4 or 5 other queries that took between 0.1 - 0.2 seconds. Again, the queries are ridiculously huge.
- is duplicated by
-
ZBXNEXT-3154 increased performance and reduced memory needs when (un)linking templates
-

- Closed
-
-
-

- Closed
-
-
-

- Closed
-
-
-
- Closed
-
-
-
- Closed
-
-
-
- Closed
-