-
Type:
Incident report
-
Resolution: Unsupported version
-
Priority:
 Trivial
-
None
-
Affects Version/s: 2.3.4
-
Component/s: Frontend (F)
-
Environment:Linux debian 3.2.0-4-amd64 #1 SMP Debian 3.2.57-3+deb7u1 x86_64 GNU/Linux
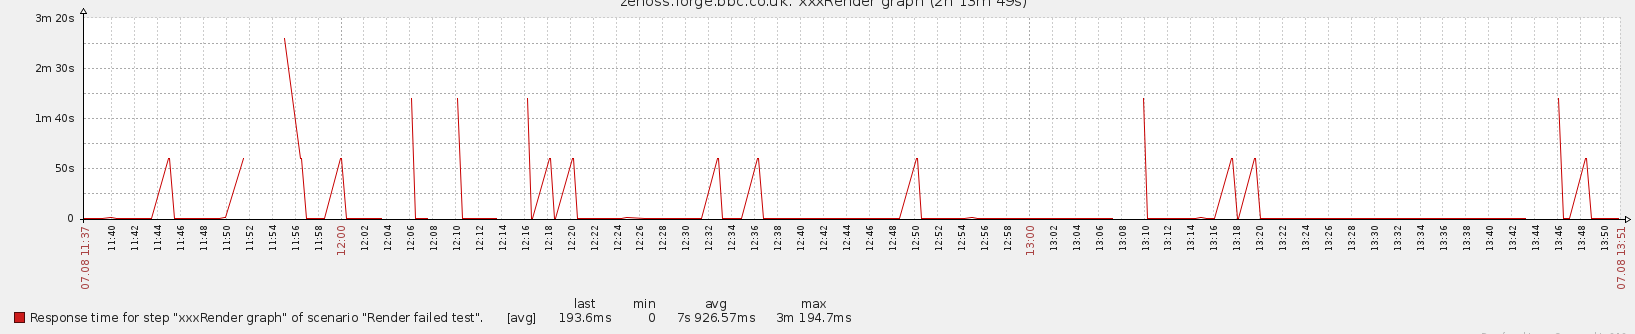
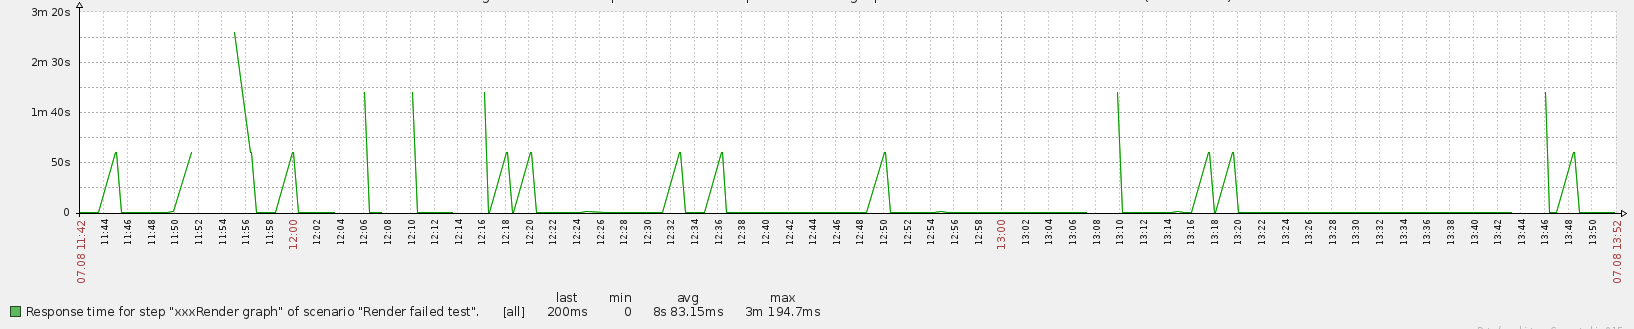
I have web scenario for my web page with one step and with 300 seconds timeout and 30 seconds update interval. Response time can be >120seconds, but usually it's <1second. Problem is with visualization of this specific values. Problem is only with graph, where metric has draw styles: Line/Bolded line/Dashed line/Gradient Line. Web monitoring graph is filled region, so there is not a problem, but graph in last data have the problem. Zooming doesn't help - I'm attaching some printscreens. Tested with Zabbix 47908 revision (trunk).