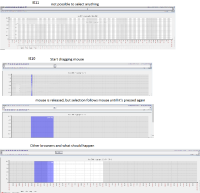
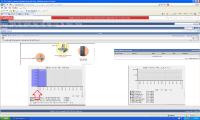
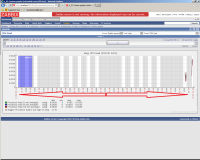
Open Monitoring > Graphs with IE11 and select any graph. Try to select a range inside graph. Impossible. Graph is treated as image. Noticed this behaviour in version 2.2.6. In 2.2.5 it seemed to work.
Similar problem is with IE10. Open same graph on IE10. Try to select a range inside graph. Once you start dragging your mouse, range selection starts as it should, but after a second it swiches to image. Release mouse and observe that range selection now follows the mouse even though it is not pressed.
ON IE9 and other browsers, the selection works fine.


