-
Type:
Incident report
-
Resolution: Cannot Reproduce
-
Priority:
 Blocker
-
None
-
Affects Version/s: 2.4.2
-
Component/s: Frontend (F)
-
None
-
Environment:ubuntu 12.04
PHP: 5.4.22
after upgrade production zabbix from 2.2 to 2.4 (upgrade zabbix stuff only, no change for OS, PHP nginx and other stuff), then face issue in zabbix frontend
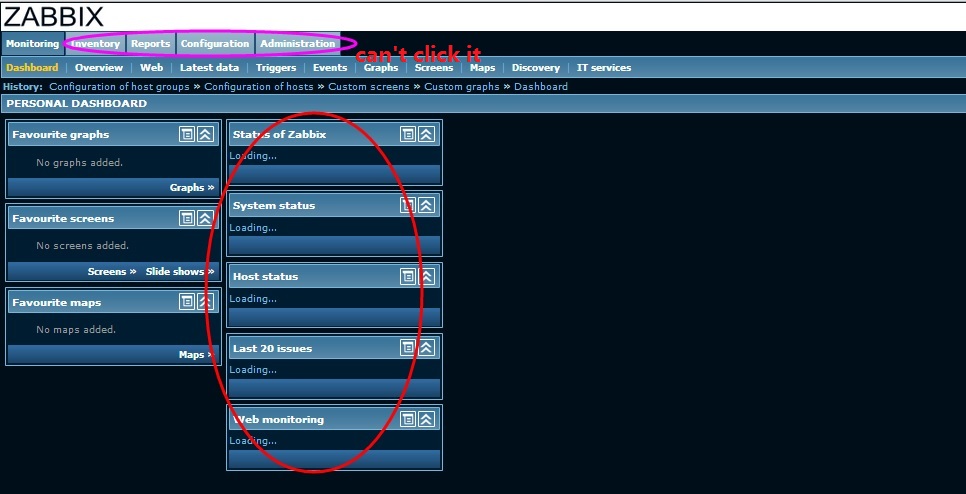
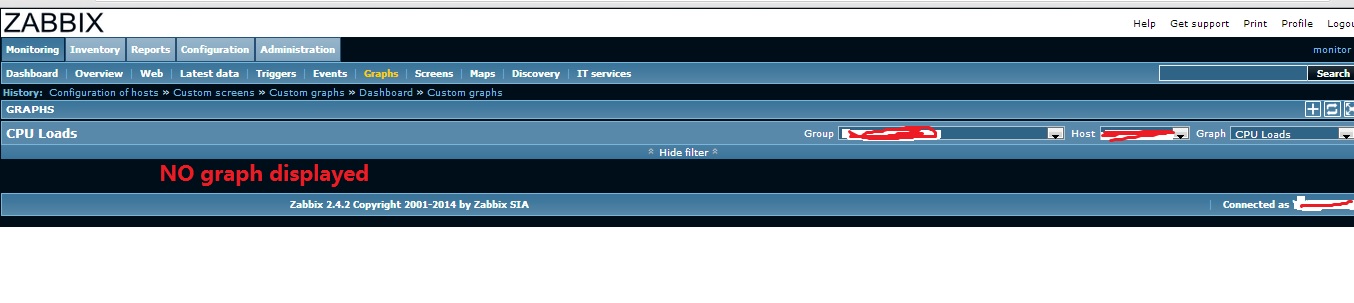
dashboard always show loading data, "monitoring" – > " graphes" and "monitor" – > "screen" can show host group, host, graph/screen name, but no data displayed
in the mean time, can't click "Inventory" "reports" "configuration", "administration" , only can click the button under "monitotring"
above issue occurred after upgrade to 2.4, (exist in 2.4.0, 2.4.1, 2.4.2),this issue not always there, it may have no issue sometimes, (clear cache, switch browser, change laptop, wait for a while may fix the issue sometimes) don't know the root cause yet.
this issue occurred in production zabbix environment (90k monitor items), have build one test zabbix environment , all same (OS, zabbix, php, nginx) but less monitor items, no issue in test zabbix environment
appreciate for any guide
Thanks