-
Type:
Incident report
-
Resolution: Unsupported version
-
Priority:
 Trivial
-
None
-
Affects Version/s: None
-
Component/s: Frontend (F)
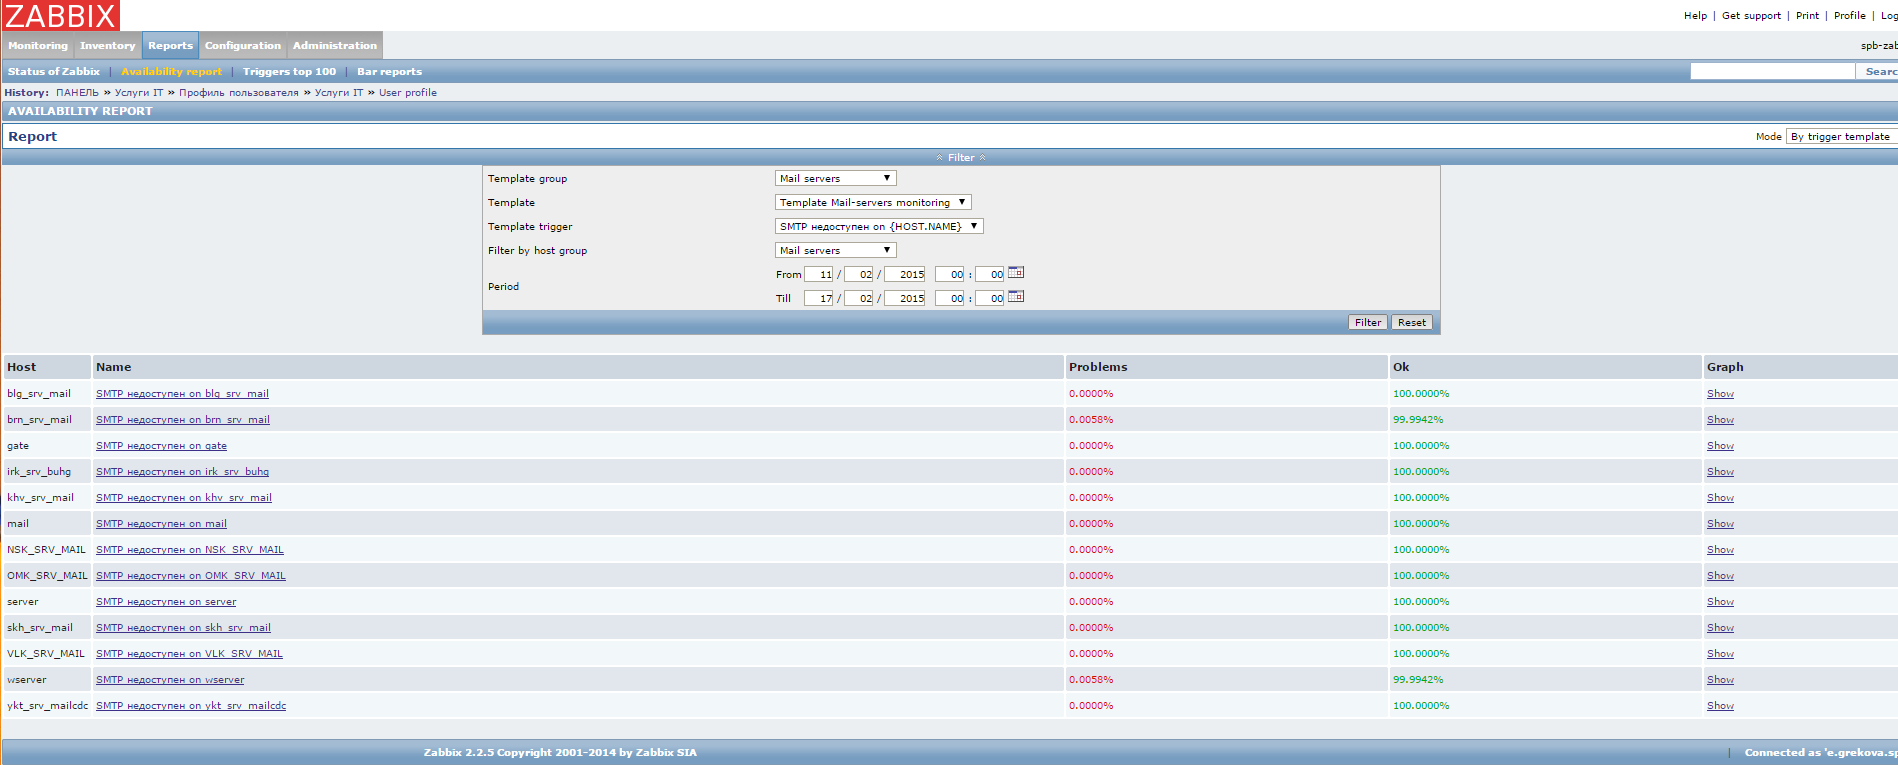
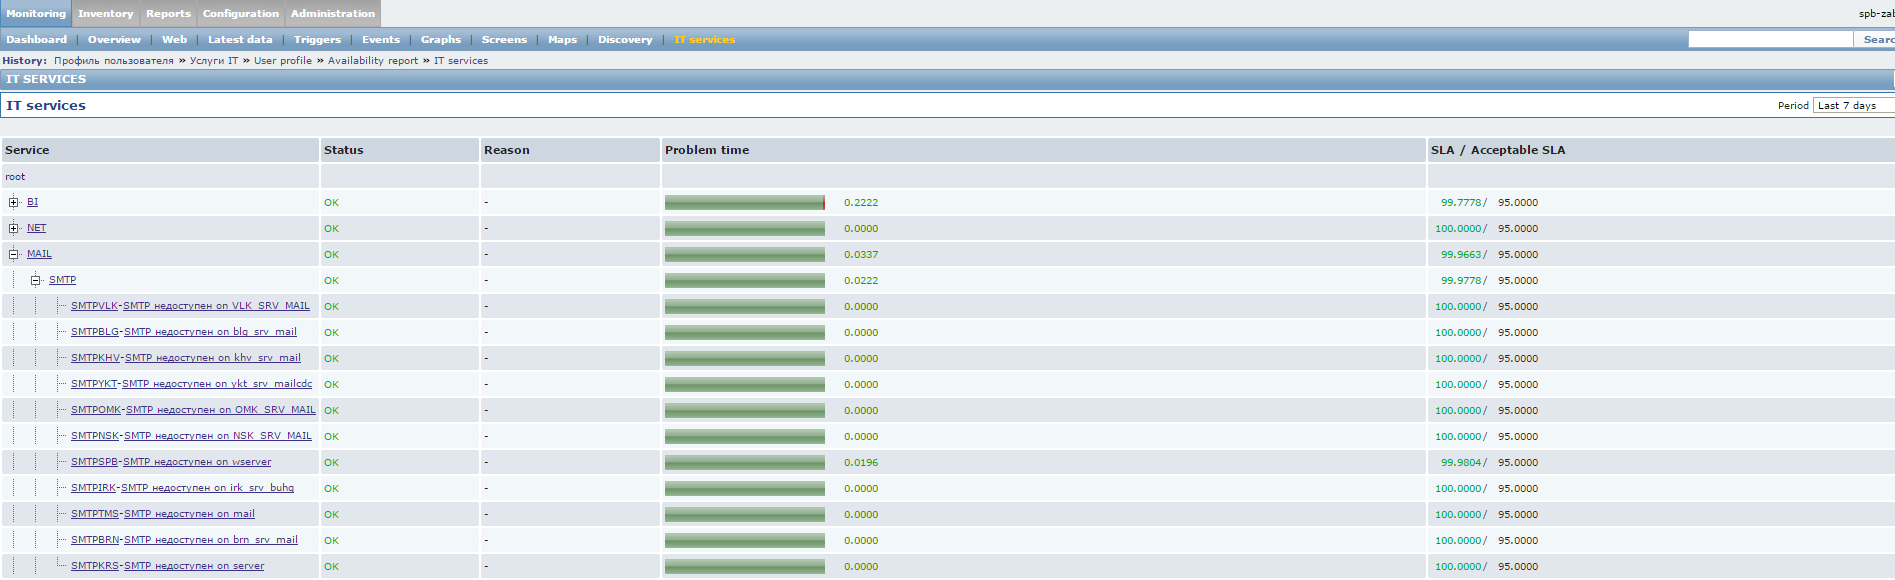
The above-mentioned data do not coincide, although the period by which I filter is the same in both tabs. I took SMTP for example, but this mismatch is observed in every monitored service.
E.g. in Monitoring-IT services we see that SMTP was unavailable on wserver for 0,0196% during the last 7 days. Whereas in the Availability report the problem time for SMTP on wserver is 0,0058%.
Please see screenshots attached. Some of the trigger names are in Russian, I can translate them if necessary