Hi,
I've added a feature to the Graph (svggraph) widget that allows for the Y-axis of a dataset to be inverted.
Motivation:
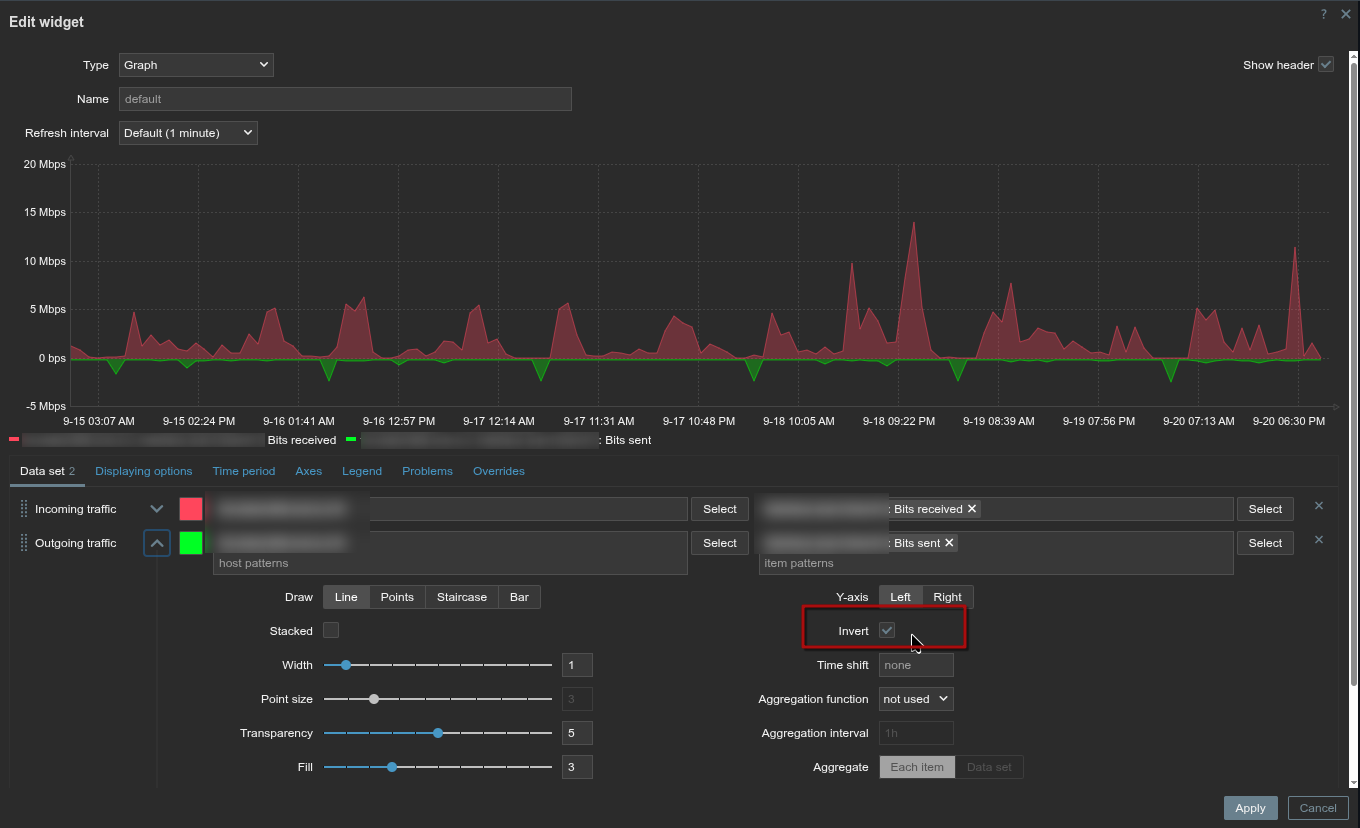
This is particularly useful for graphing metrics like network traffic, where you might want to display incoming traffic as positive values and outgoing traffic as negative values on the same graph. This improves the readability and provides a more intuitive visualization.
Implementation:
* An "Invert" checkbox has been added to the dataset configuration options.
* If checked, all Y-values for that dataset are multiplied by -1 before the graph is rendered.
* The legend has also been updated to correctly display the min, max, and average values for inverted datasets.
This provides a simple and effective way to control the visual representation of data. Changes are only made to the widget code (ui/widgets/svggraph).
I have attached patch files for 7.2.12 & 7.4.2 with the necessary changes.
Thanks and hopes this could be implemented.
- duplicates
-
ZBXNEXT-943 Positive and negative y-axis graphing support
-

- Closed
-