-
Type:
New Feature Request
-
Resolution: Unresolved
-
Priority:
 Minor
Minor
-
None
-
Affects Version/s: 1.9.9 (beta)
-
Component/s: Frontend (F)
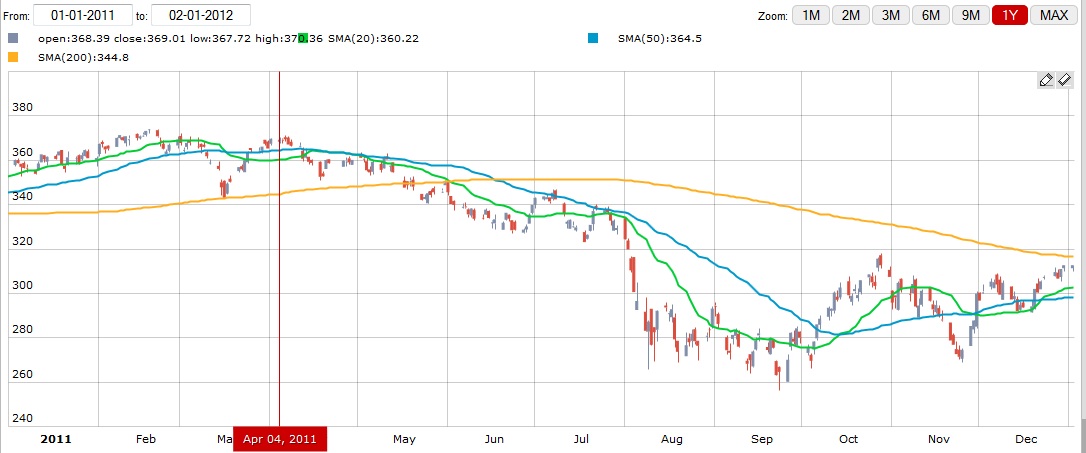
In cases it can be handy to show values while mousing over a graph.
I found this example, where you seem to drag a red indicator along the graph, that also shows the exact time for the readings. The moused-over readings could just be shown in an additional column next to last, min, avg and max. That should be space-saving and not mask the actual graph.
From a technical point of view, the data could be transmitted along after generating the graph. It's already retrieved at that time and dynamically polling for it is certainly uneconomic.
- is duplicated by
-
-

- Closed
-
-
ZBX-7844 mouse over on value to show graphs
-
- Closed
-
-
ZBX-10910 Show measuring points values when hovering mouse
-
- Closed
-
-
-
- Closed
-
- part of
-
-

- Closed
-