-
Type:
Change Request
-
Resolution: Fixed
-
Priority:
 Blocker
-
Affects Version/s: None
-
Component/s: Frontend (F)
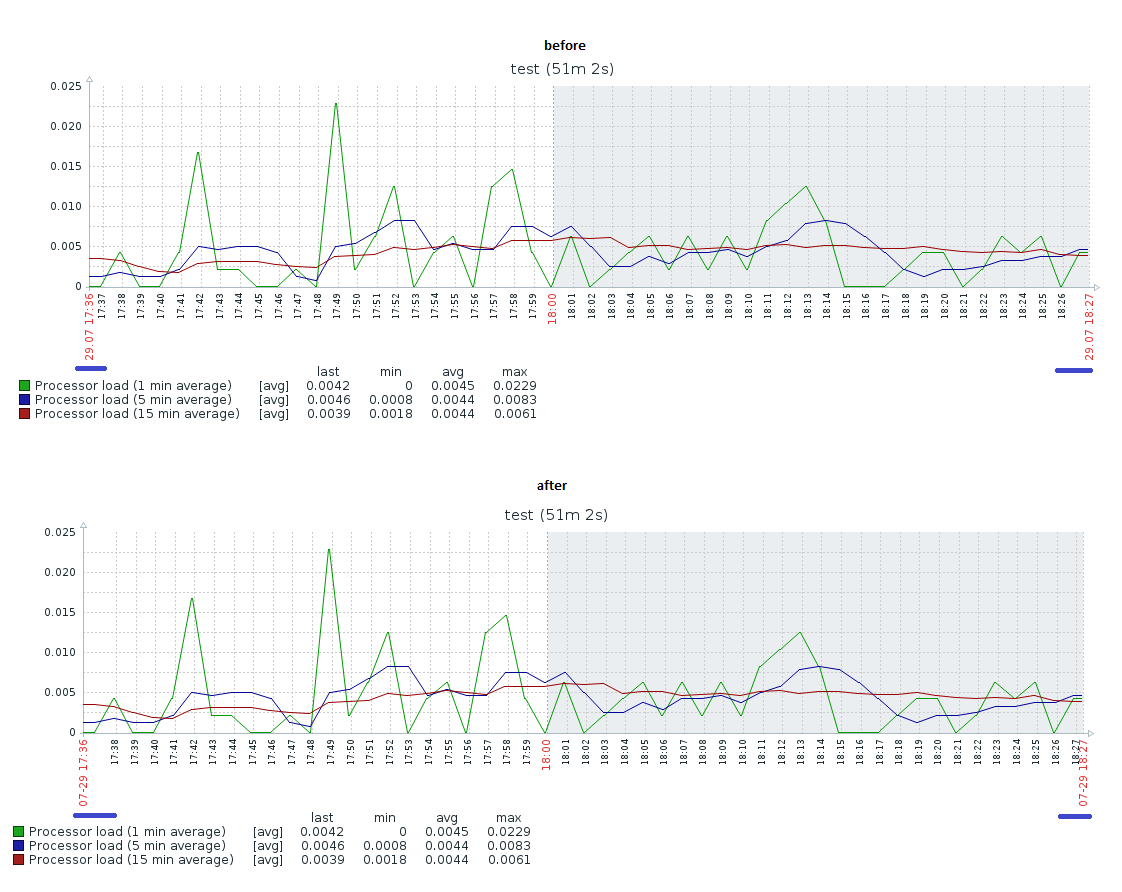
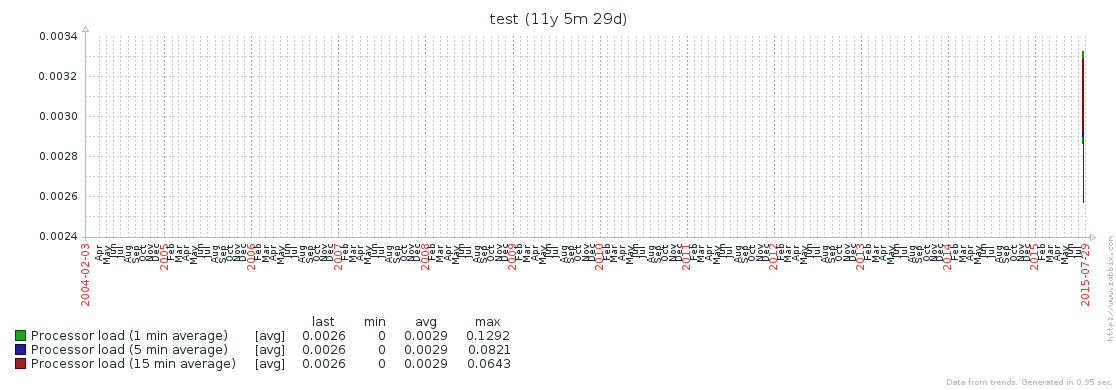
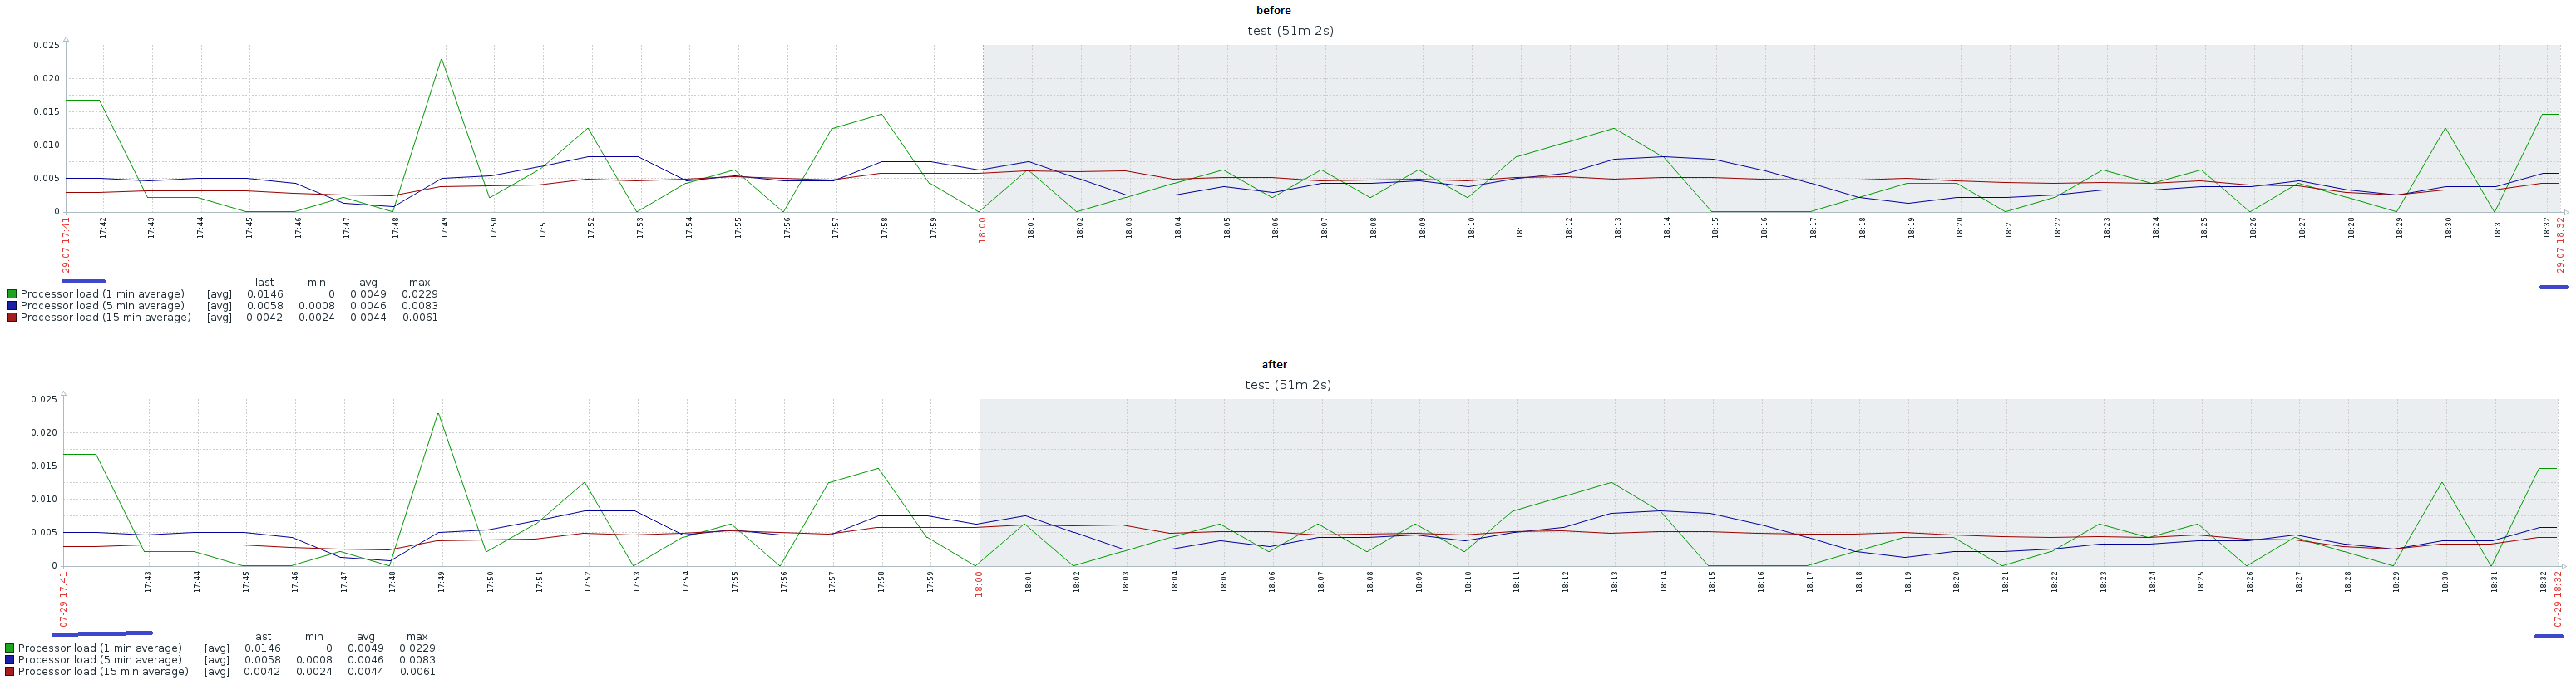
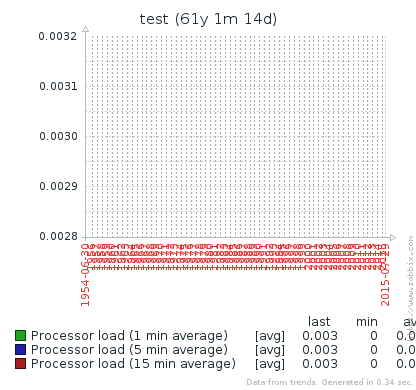
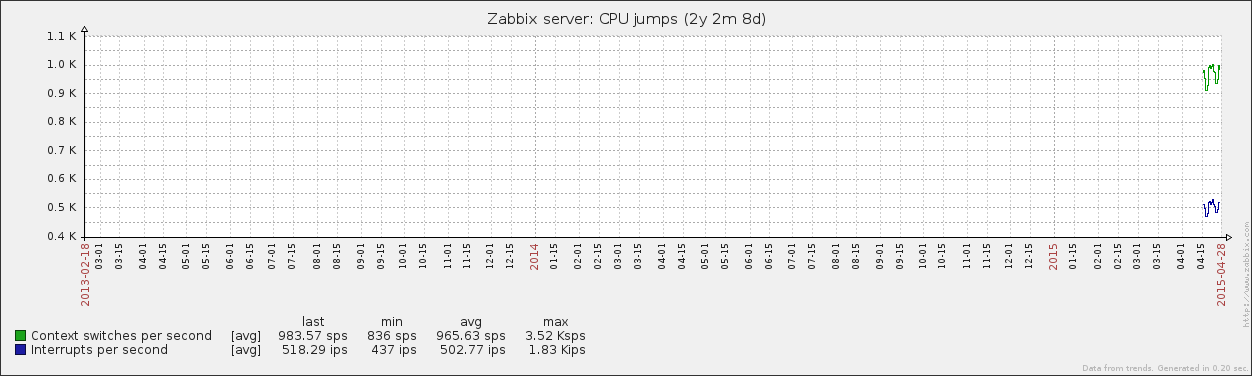
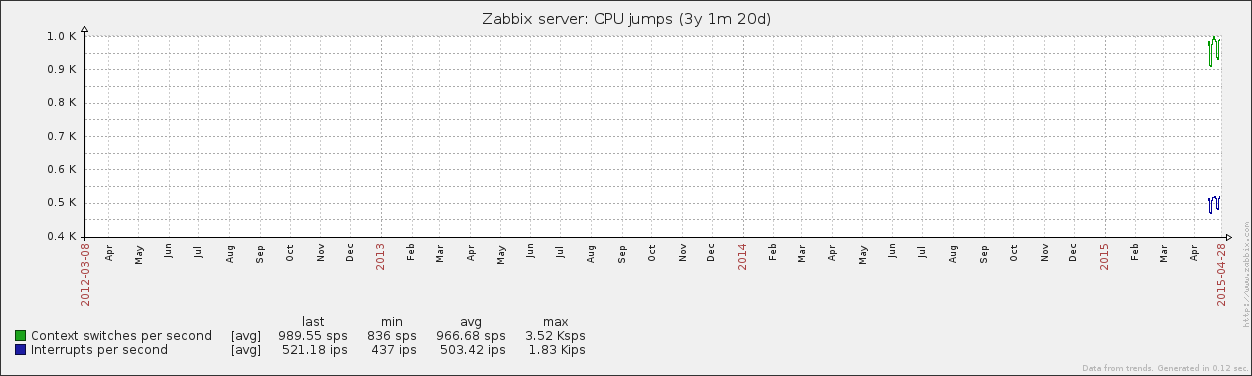
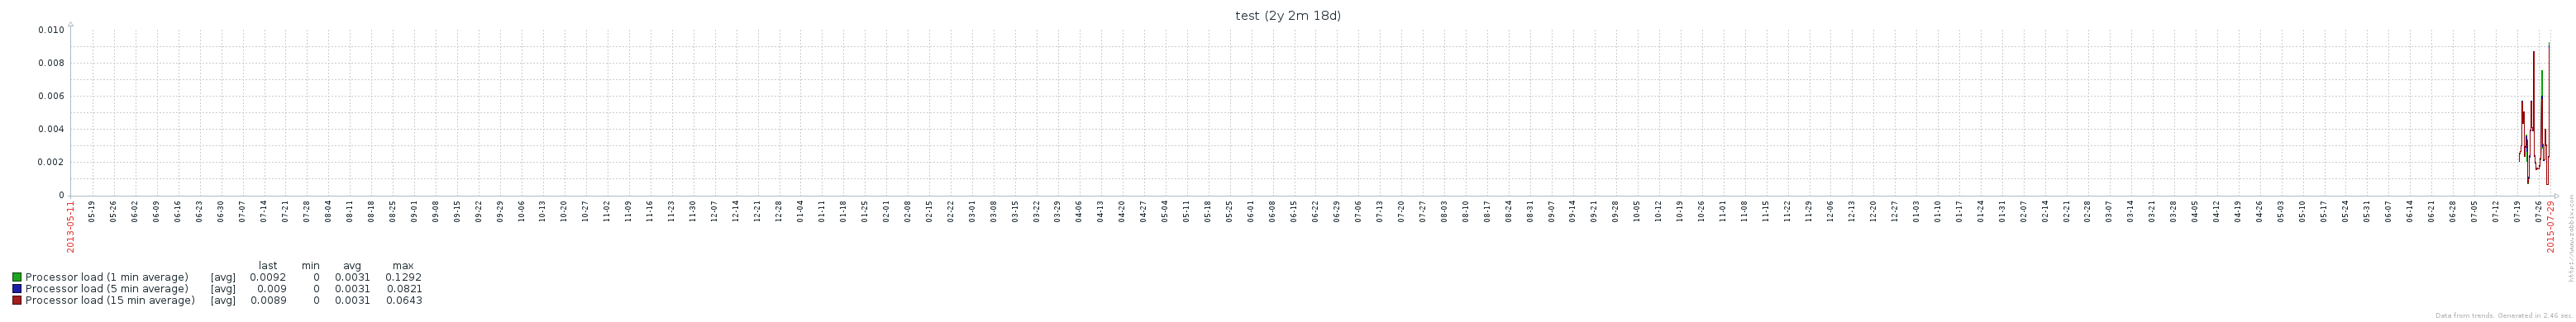
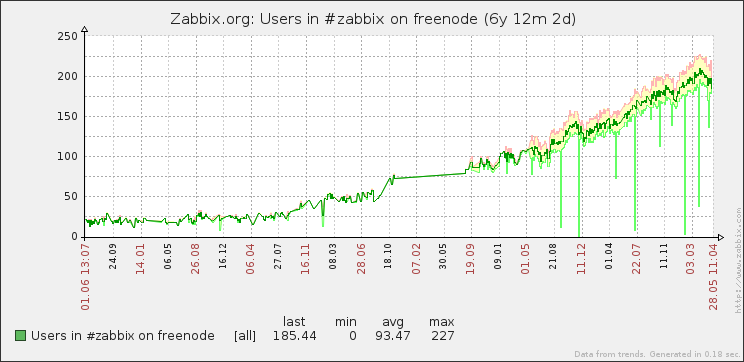
currently looking at a graph that shows data for a couple of years is somewhat challenging - it is not clear where year border is at all. it's not marked in any way or shown on the x axis labels. see the attached graph for an example
- is duplicated by
-
ZBX-1121 graph layout issues
-
- Closed
-