-
Type:
Change Request
-
Resolution: Duplicate
-
Priority:
 Minor
Minor
-
None
-
Affects Version/s: None
-
Component/s: Frontend (F)
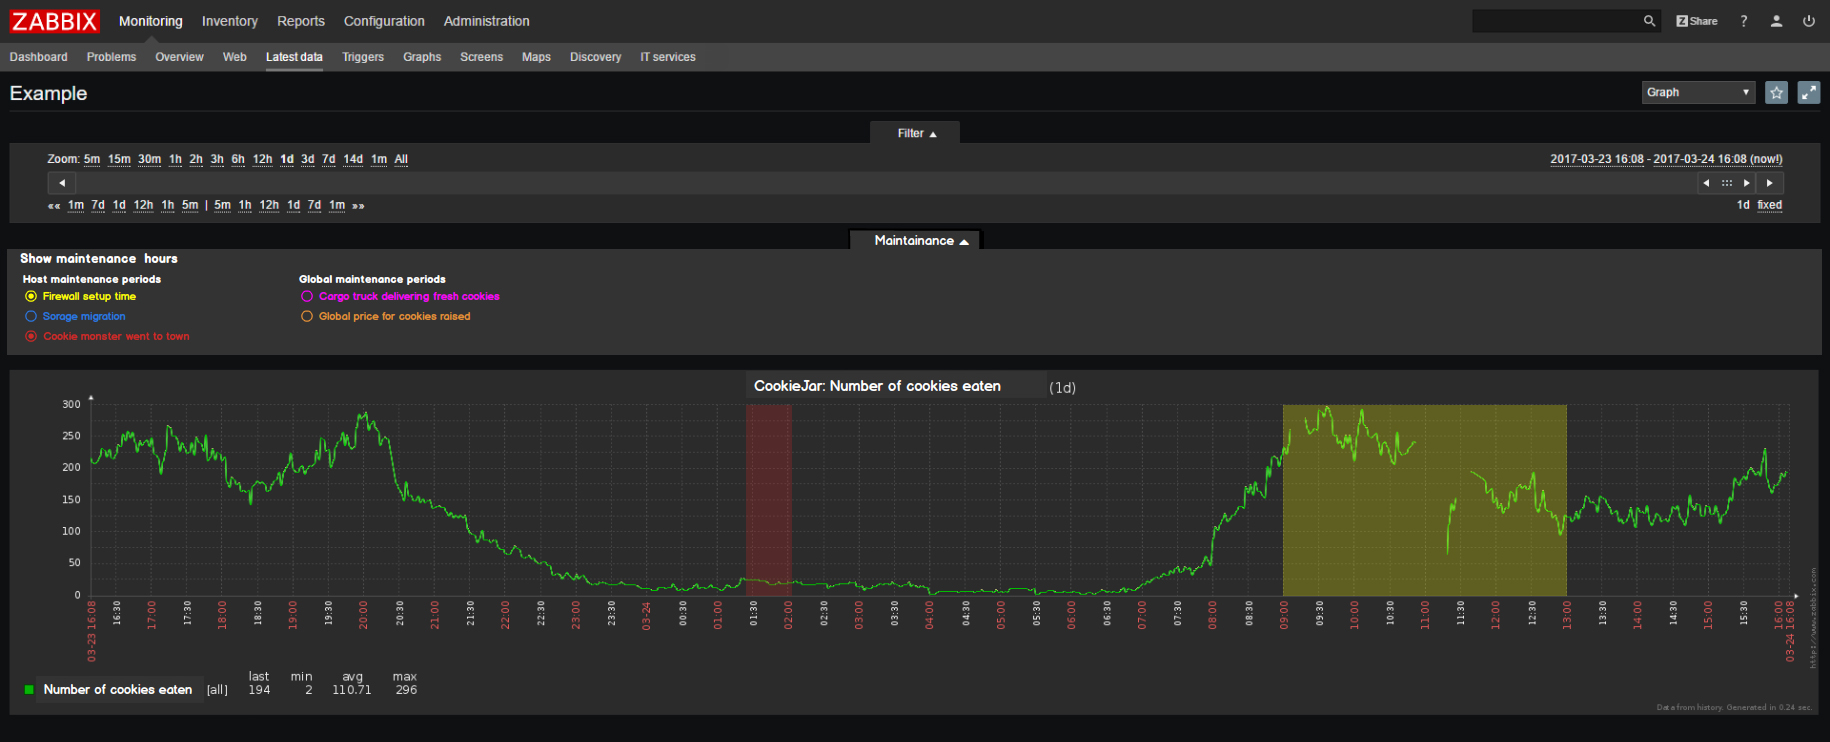
I have thought about this for a while. What if maintenance periods was shown in graphs?
Example: Let's say you are looking at all sorts of different screens to make out why you didn't eat as many cookies in a period of time, back 2 weeks ago, but you have forgotten that you made a maintenance periode on your whole "cookie eaters group". If you were able to see that your "cookie eater host" was in a maintenance periode or globally there were a maintenance period on other machines at that time. It would help a lot with debugging a problem.
- duplicates
-
ZBXNEXT-2713 Display active maintenance periods (or deployments) on graphs
-
- Open
-