-
Type:
New Feature Request
-
Resolution: Unresolved
-
Priority:
Trivial
-
None
-
Affects Version/s: None
-
Component/s: Frontend (F)
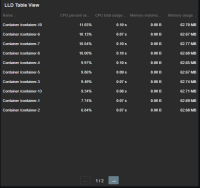
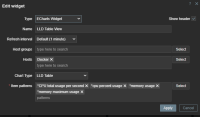
items discovered from LLD comes as two dimensional array basically… we should introduce Widget on the dashboard that would allow to see such data as a table for such items similar to Overview page but instead of hosts we should use LLD objects as columns.
Again, color highlighting items that have active triggers in these tables (just like in overview) is a must
Filtered: by Host: cisco2950
          by Application: Interfaces

-----------------------Interface Gi0/0| Interface Gi0/1| Interface Gi0/2| Interface Gi0/3|
In                  |   95.7Mbps      |      0bps      |      3Mbps     |      11.5Mbps  |
Out                 |   15.3Mbps      |      0bps      |      0.5Mbps   |      100Kbps   |
Errors In           |   0             |      0         |      0         |      0         |
Errors Out          |   0             |      0         |      0         |      0         |
Status              |   up(1)         |      down(2)   |      up(1)     |      up(1)     |
Alias               |   uplink        |      -         |      -         |      servx     |
- duplicates
-
ZBXNEXT-248 Improved and more advanced reporting and statistics
-
- Closed
-
- part of
-
ZBXNEXT-418 customisable "overview" widget
-
- Open
-


