-
Type:
Change Request
-
Resolution: Unresolved
-
Priority:
 Trivial
-
None
-
Affects Version/s: 3.4.5
-
Component/s: Frontend (F)
Steps to reproduce:
- Go to Monitoring>Latest data
- Select something (I picked Zabbix server / Zabbix queue)
- Click graph
- Set the graph range to something sizable that covers a significant amount of variation
Result:
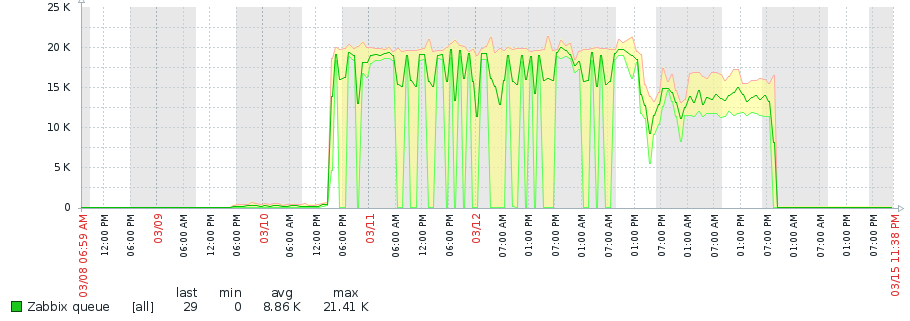
See screenshot...
Note that the legend only shows a single color: green
Note that there are in fact 4 colors:
- bright green
- green
- pale yellow
- pale red
Expected:
The legend should indicate that light green represents "min", pale red represents max, and that pale yellow is a range between them...