-
Type:
Change Request
-
Resolution: Unresolved
-
Priority:
Minor
-
None
-
Affects Version/s: 4.2.3
-
Component/s: Frontend (F)
The last vertical line is not always drawn on a graph if there is no space for the label on the axis. Even though there is no space for the label, the vertical line should still be drawn.
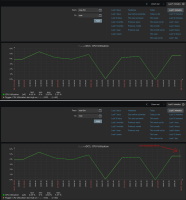
Check my attached screen shot: I expect a line to be drawn for 10:43:40. Since there is no space for the label it's OK not the write the label, but I see no valid reason for the line not to be drawn.
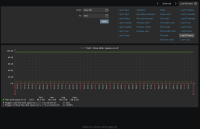
To implement this change, I updated file include/classes/graphdraw/CLineGraphDraw,php. I did not test it with all possible graphs but I think it's pretty safe. See attached images.
Here is my diff, from version 4.2.3 (you can use it Zabbix...):
1243a1244
> * @param bool $drawLabel Should we draw the period label? If false, we only draw the vertical line.
1245c1246
< private function drawMainPeriod($value, $position) {
—
> private function drawMainPeriod($value, $position, $drawLabel) {
1248,1256c1249,1259
< imageText(
< $this->im,
< 8,
< 90,
< $this->shiftXleft + $position + round($dims['width'] / 2),
< $this->sizeY + $this->shiftY + $dims['height'] + 6,
< $this->getColor($this->graphtheme['highlightcolor'], 0),
< $value
< );
—
> if ($drawLabel) {
> imageText(
> $this->im,
> 8,
> 90,
> $this->shiftXleft + $position + round($dims['width'] / 2),
> $this->sizeY + $this->shiftY + $dims['height'] + 6,
> $this->getColor($this->graphtheme['highlightcolor'], 0),
> $value
> );
> }
1272c1275
< * @param strimg $value Readable timestamp.
—
> * @param string $value Readable timestamp.
1273a1277
> * @param bool $drawLabel Should we draw the period label? If false, we only draw the vertical line.
1275c1279
< private function drawSubPeriod($value, $position) {
—
> private function drawSubPeriod($value, $position, $drawLabel) {
1278,1286c1282,1292
< imageText(
< $this->im,
< 7,
< 90,
< $this->shiftXleft + $position + round($element['width'] / 2),
< $this->sizeY + $this->shiftY + $element['height'] + 6,
< $this->getColor($this->graphtheme['textcolor'], 0),
< $value
< );
—
> if ($drawLabel) {
> imageText(
> $this->im,
> 7,
> 90,
> $this->shiftXleft + $position + round($element['width'] / 2),
> $this->sizeY + $this->shiftY + $element['height'] + 6,
> $this->getColor($this->graphtheme['textcolor'], 0),
> $value
> );
> }
1477a1484,1490
> // Did we reach the end of graph yet?
> if ($position > $this->sizeX) {
> break;
> }
>
> $drawLabel = true;
>
1479,1483c1492,1494
< if ($prev_time != $this->stime || $delta_x > $element_size['width']) {
< // Last element overlaping check.
< if ($position > $this->sizeX - $element_size['width']) {
< break;
< }
—
> if ($prev_time == $this->stime && $delta_x <= $element_size['width']) {
> $drawLabel = false;
> }
1485,1490c1496,1505
< if ($draw_main) {
< $this->drawMainPeriod($dt['sub']->format($format['main']), $position);
< }
< else {
< $this->drawSubPeriod($dt['sub']->format($format['sub']), $position);
< }
—
> // Last element overlaping check.
> if ($position > $this->sizeX - $element_size['width']) {
> $drawLabel = false;
> }
>
> if ($draw_main) {
> $this->drawMainPeriod($dt['sub']->format($format['main']), $position, $drawLabel);
> }
> else {
> $this->drawSubPeriod($dt['sub']->format($format['sub']), $position, $drawLabel);

