-
Type:
New Feature Request
-
Resolution: Unresolved
-
Priority:
 Major
Major
-
None
-
Affects Version/s: None
-
Component/s: None
-
None
We have a template with an item and associated trigger and graph.
Currently to see the graph for each host that uses that template in a screen, we need to manually add the graph for each host.
Considering our ecosystem is in AWS with numerous dynamic hosts, it's really painful to keep updating this screen manually each time the host set changes.
We would like to see an option to add a graph from template. Then the screen will find out which all host uses that template and show its corresponding graph. Something similar to how graph prototype works for a single host.
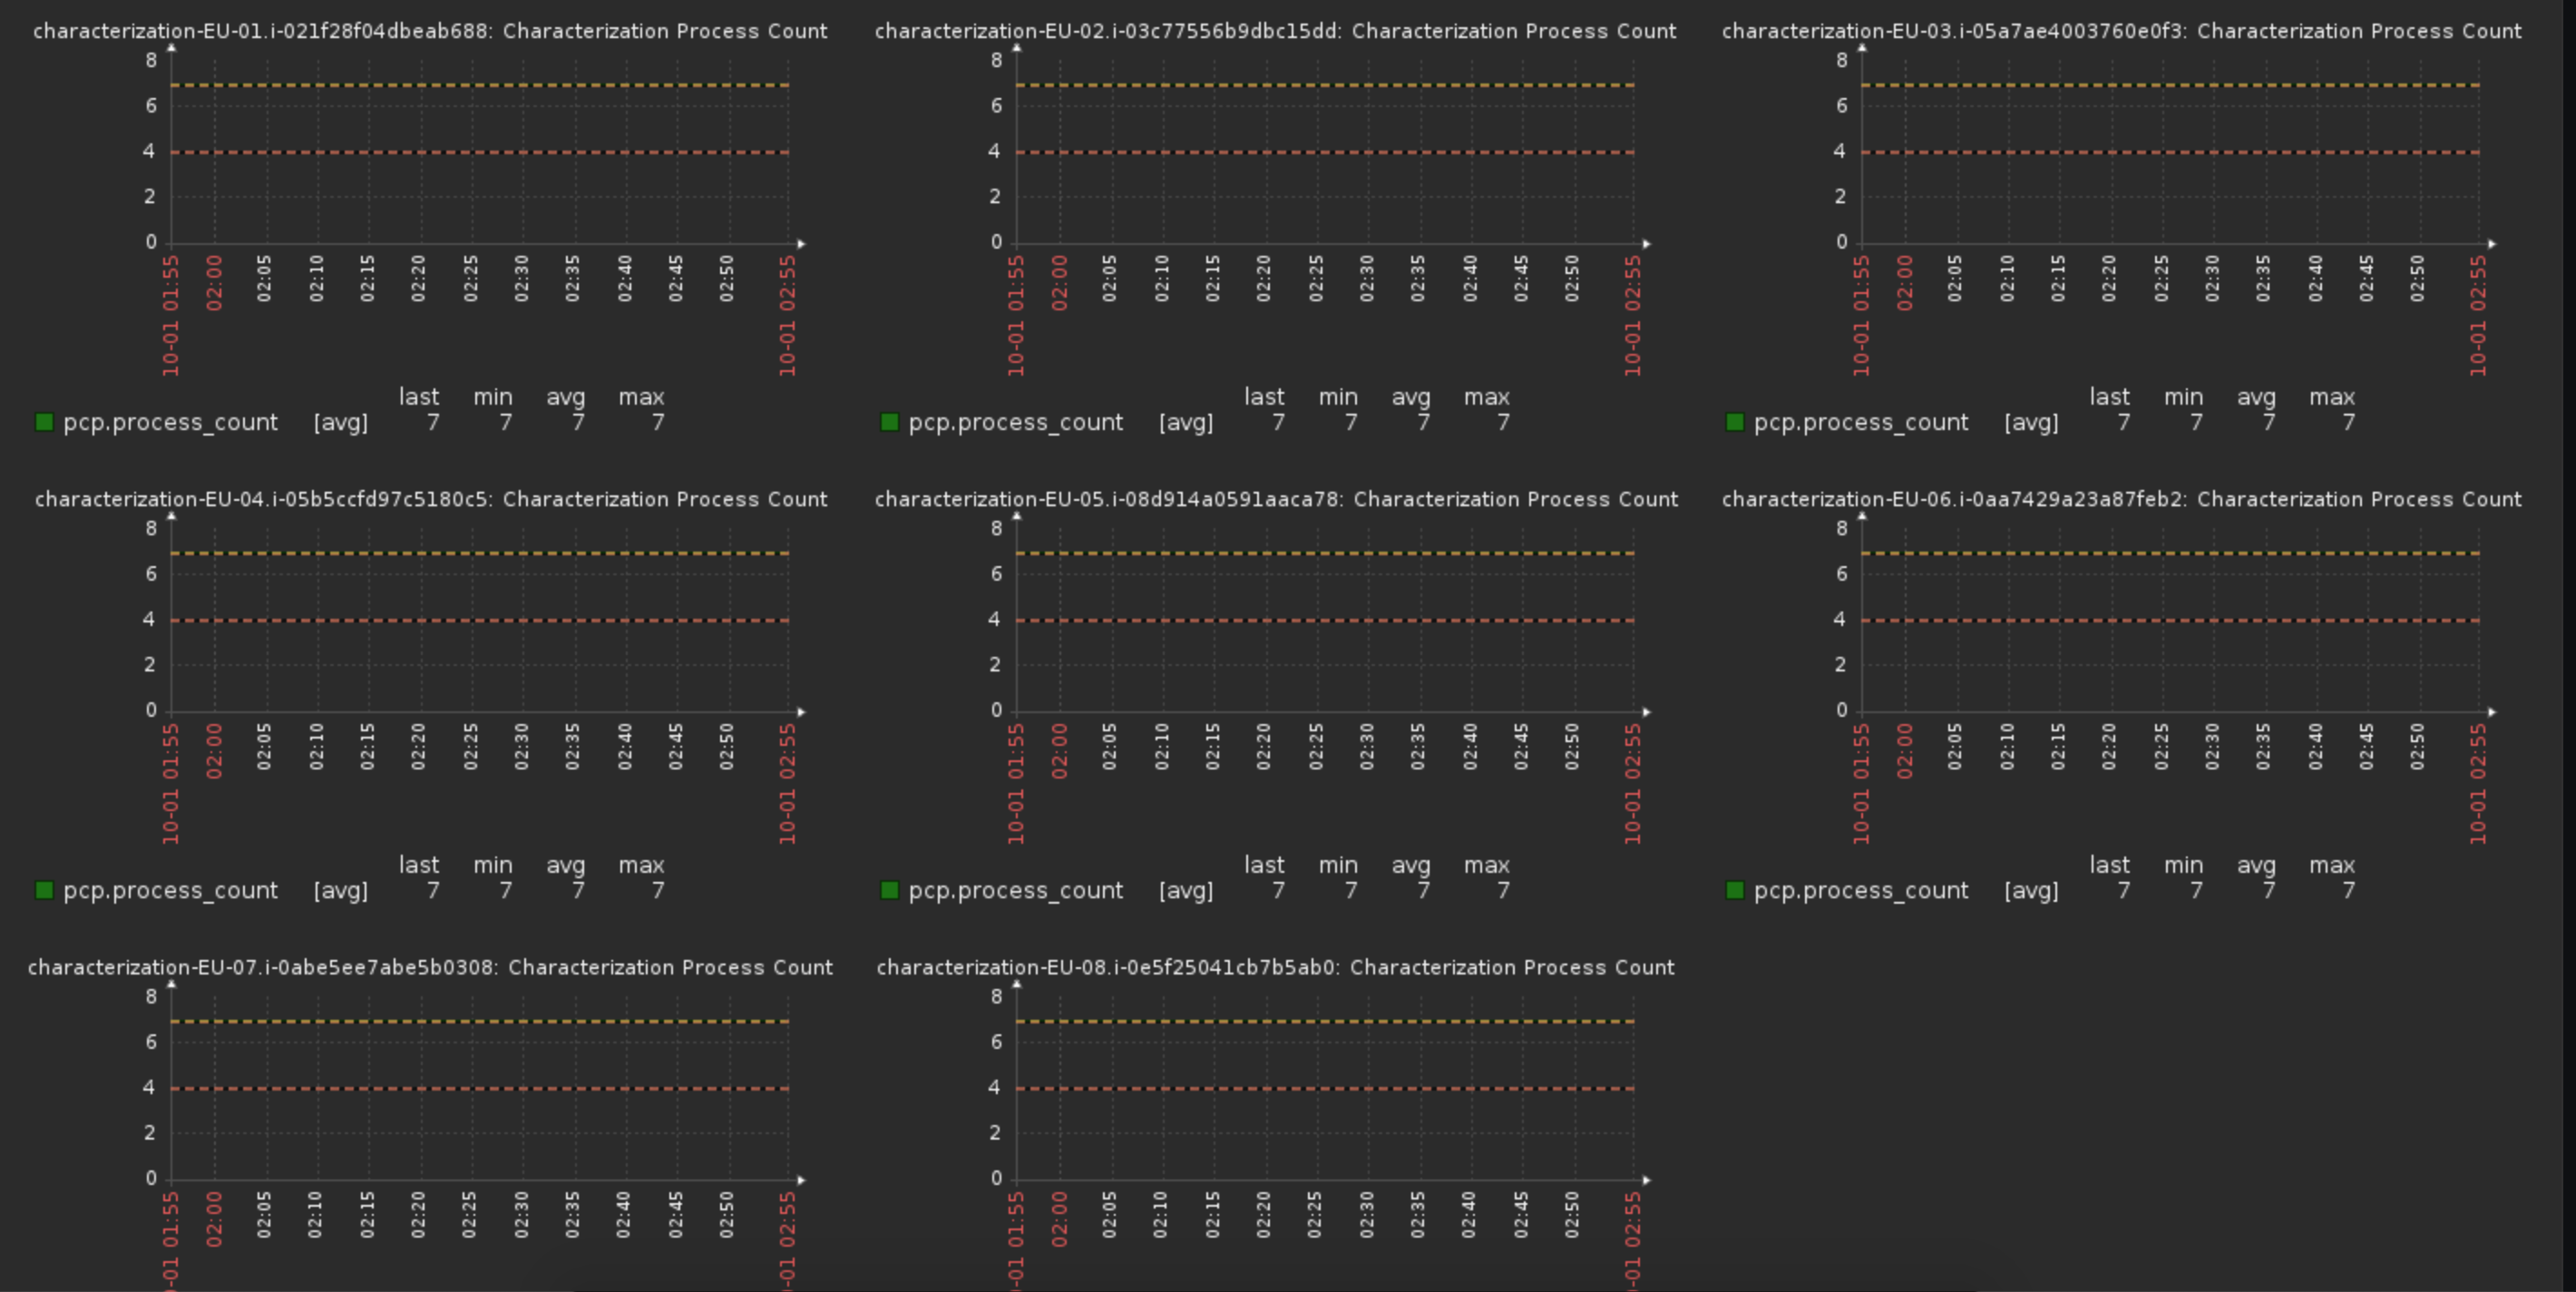
Following is an example of manually created screen -