-
Type:
New Feature Request
-
Resolution: Unresolved
-
Priority:
 Minor
Minor
-
None
-
Affects Version/s: 5.0.3
-
Component/s: Frontend (F)
-
None
-
Environment:OS: CentOS Linux 7
Zabbix version: 4.4.7
Steps to reproduce:
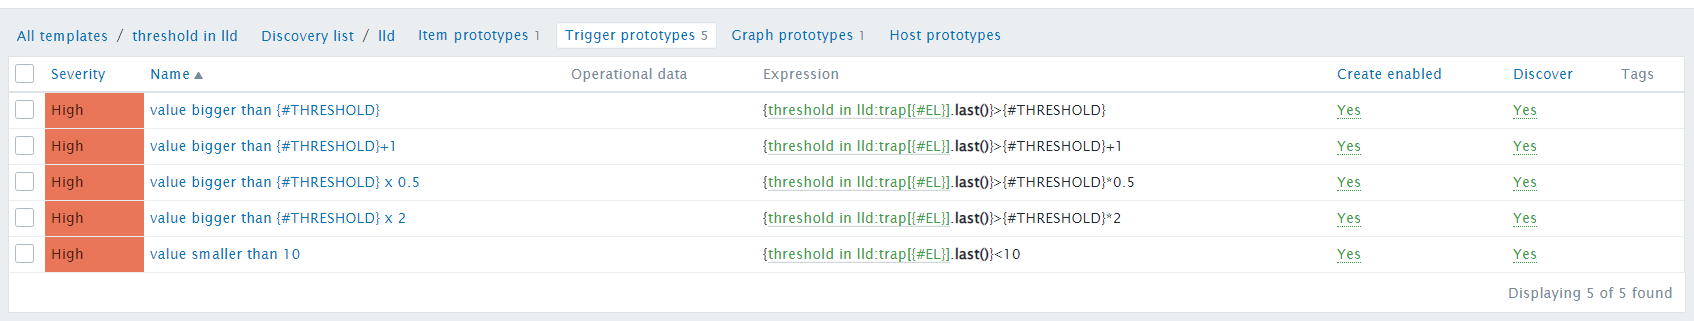
- Created an LLD rule
- Created a trigger prototype ()
- Created a prototype char
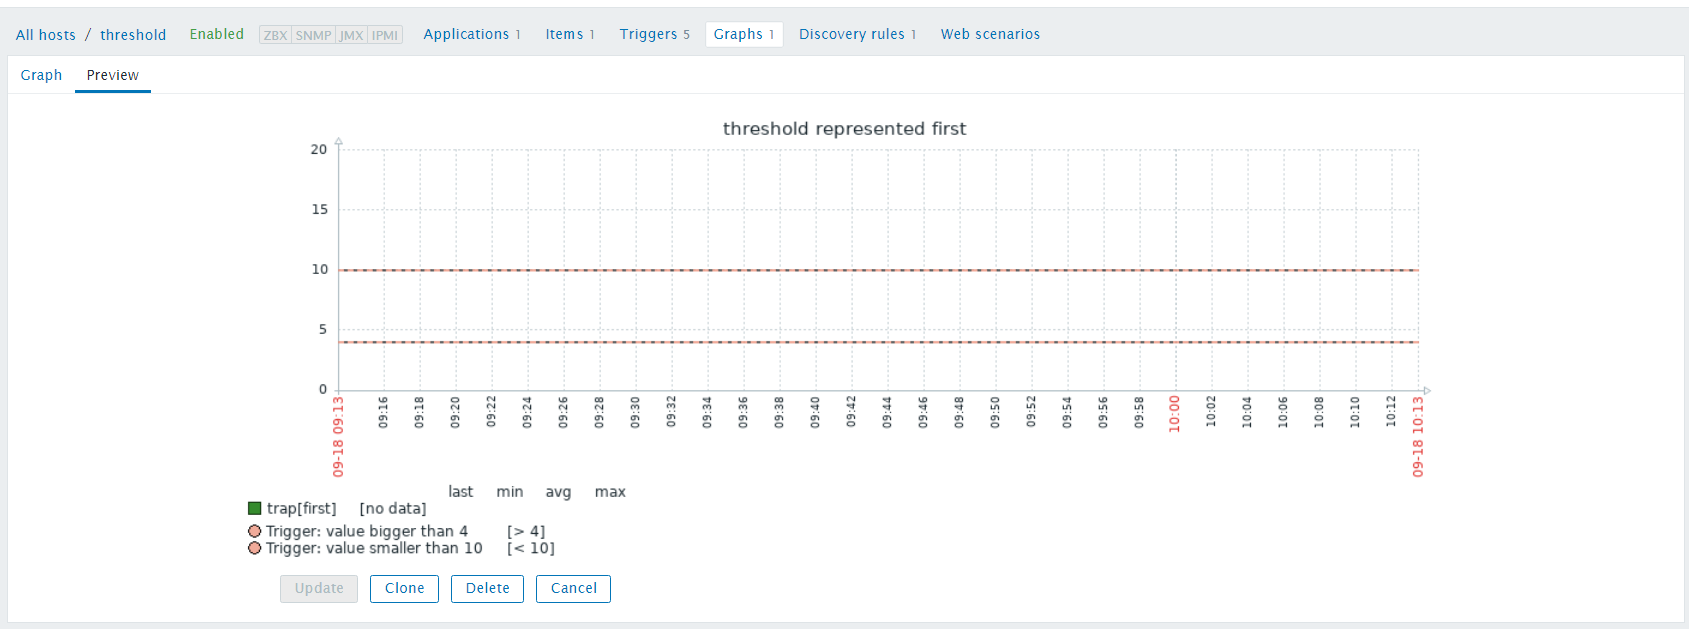
Result:
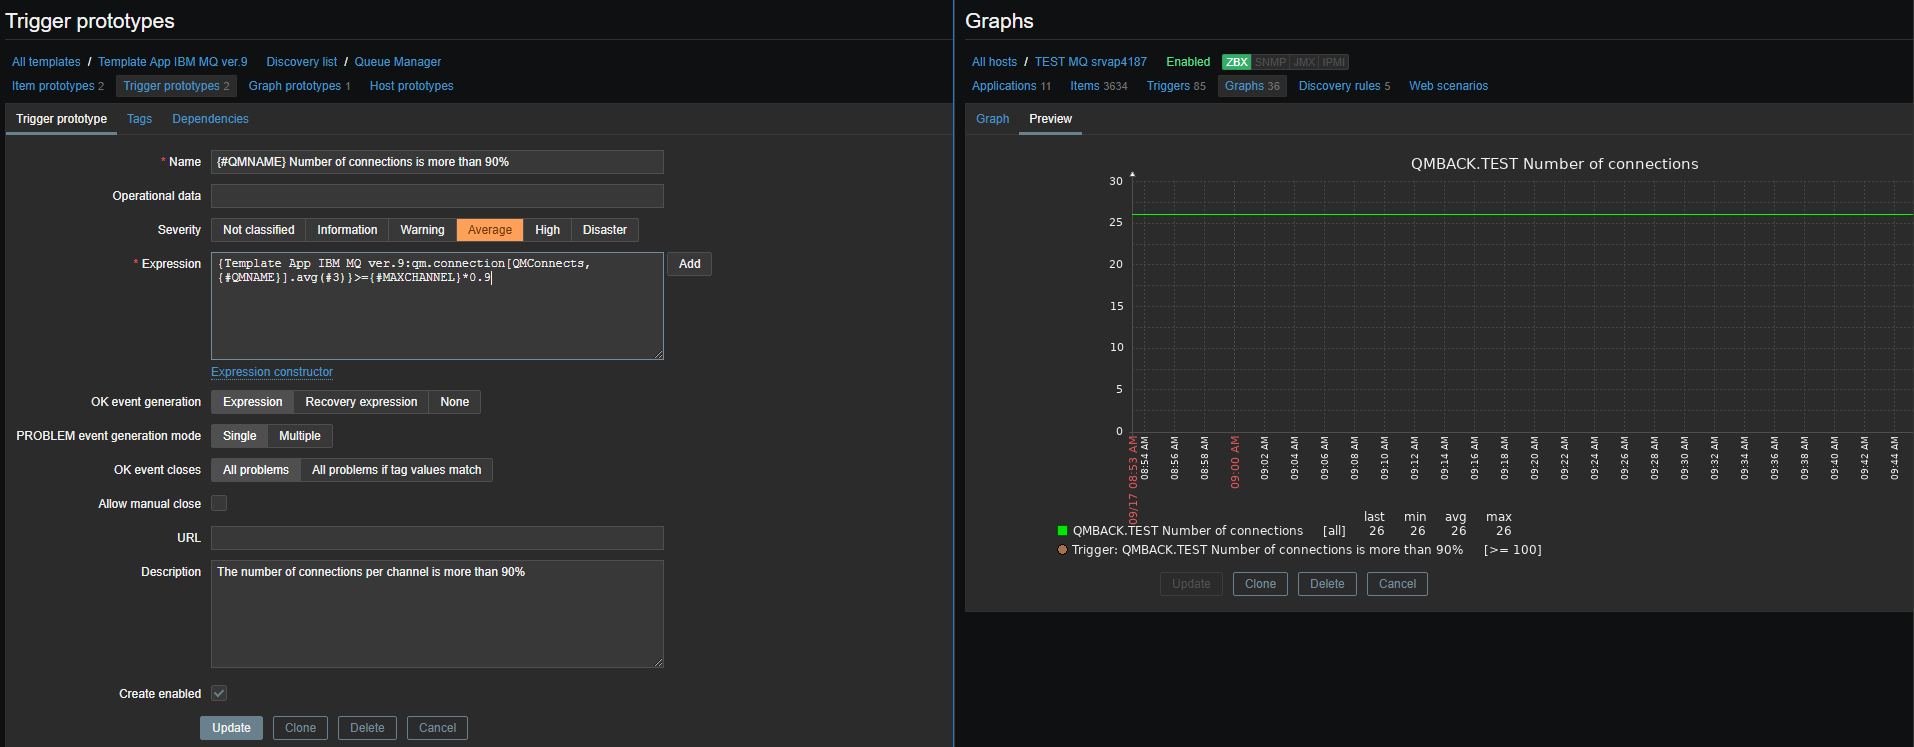
1. If I use "{#MAXCHANNEL} * 0.9" in the trigger expression
ex.: {Template App IBM MQ ver.9:qm.connection[QMConnects,
that the trigger is not displayed on the chart

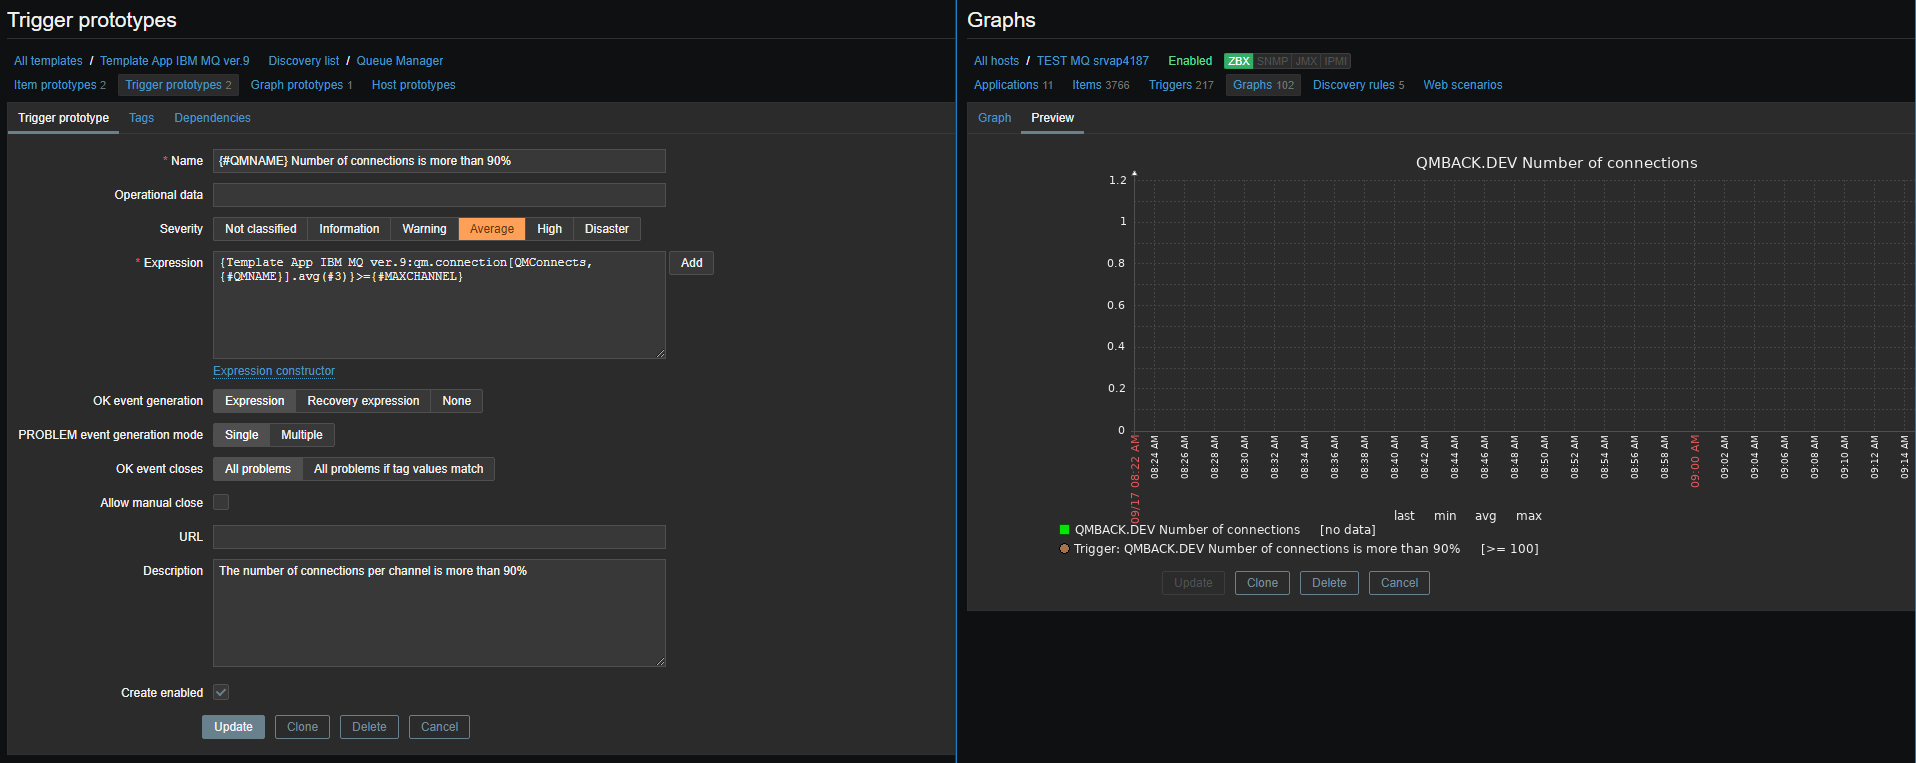
2. If I use {#MAXCHANNEL} in the trigger expression:
ex.: {Template App IBM MQ ver.9:qm.connection[QMConnects,{#QMNAME}
].avg(#3)}>={#MAXCHANNEL}, that the trigger is displayed on the chart

Expected:
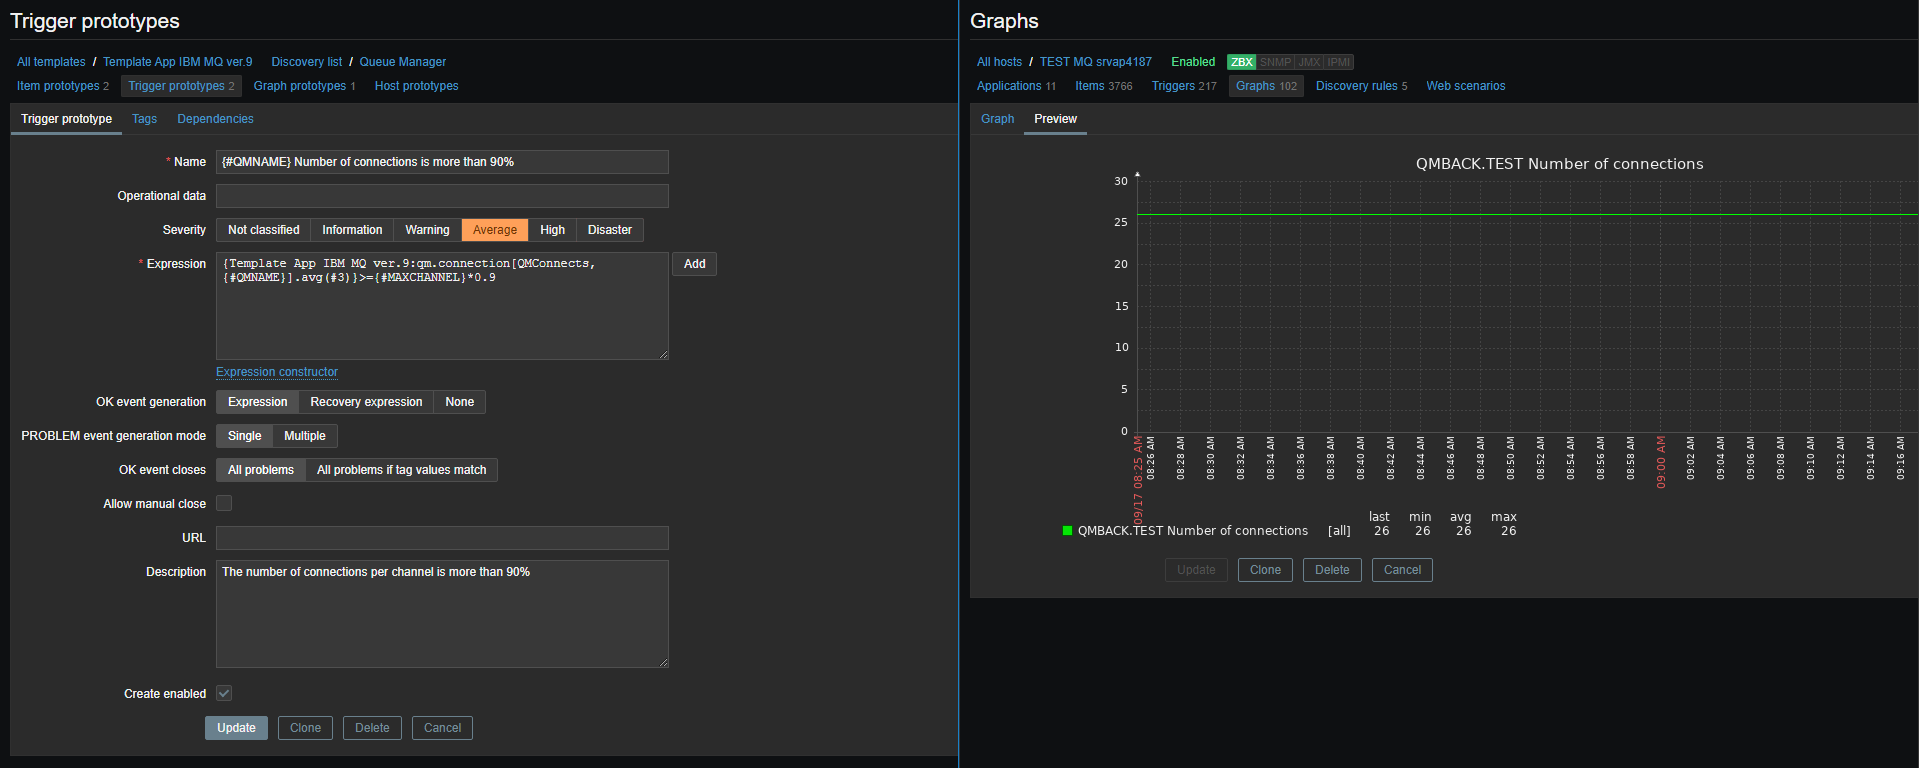
1. If I use "{#MAXCHANNEL} * 0.9" in the trigger expression
ex.: {Template App IBM MQ ver.9:qm.connection[QMConnects,
].avg(#3)}>={#MAXCHANNEL}*0.9,
that the trigger is displayed on the chart