-
Type:
New Feature Request
-
Resolution: Unresolved
-
Priority:
 Medium
-
None
-
Affects Version/s: None
-
Component/s: Frontend (F)
-
None
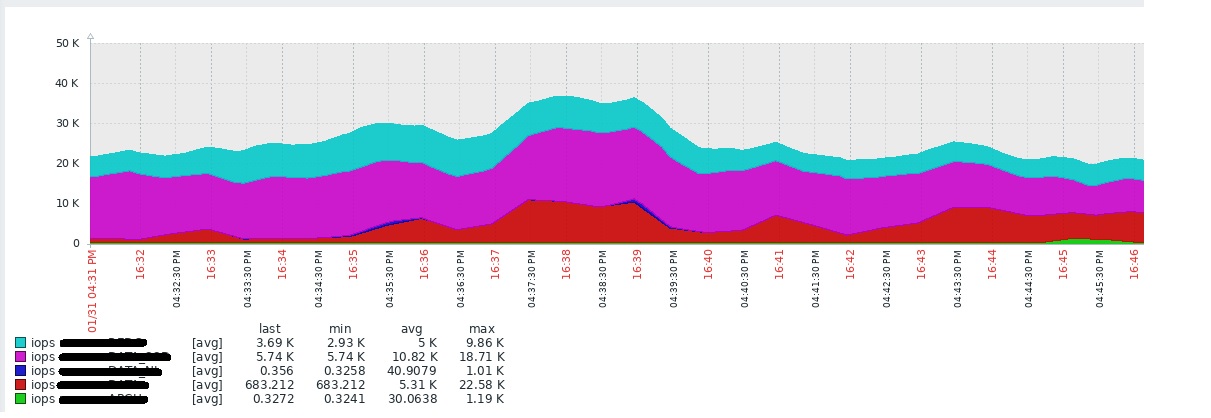
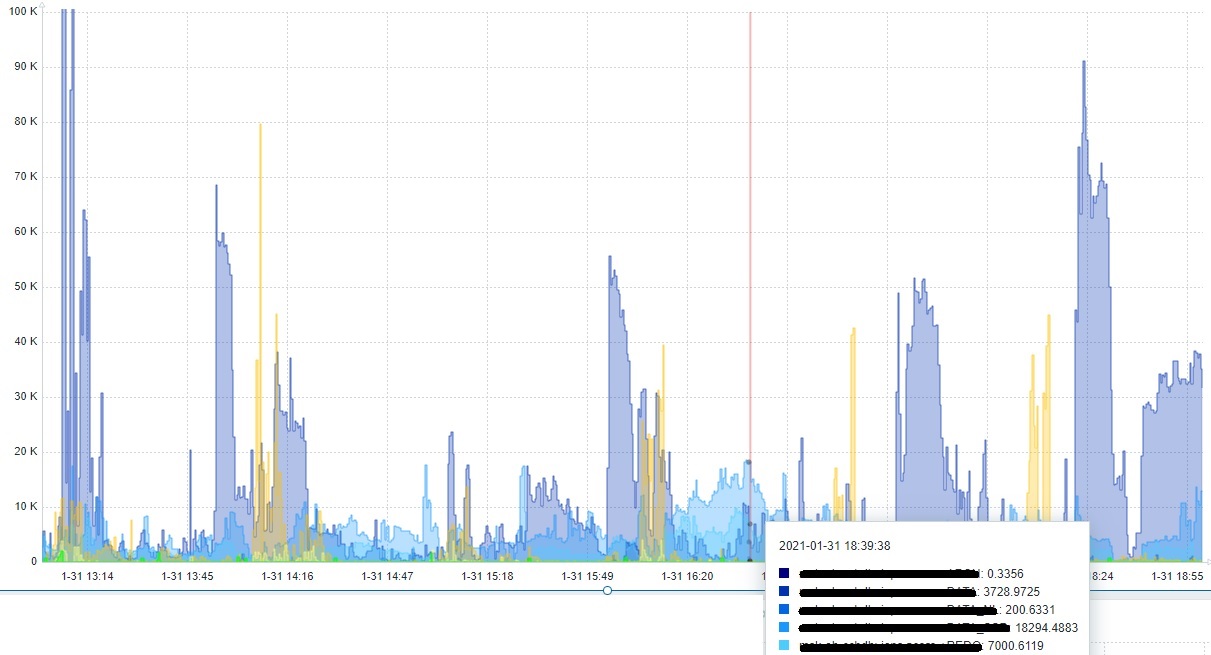
I beg to make the ability to make stackable graphics in the new dashboards. for example, there are 5 disk groups in the database. performance elements are collected from each disk group, in this example Iops, but they are all located on one storage system. it would be very convenient if these data could be stacked as in the classic graphs on the file stack, but as beautifully and dynamically as in the picture unstack