-
Type:
Change Request
-
Resolution: Unresolved
-
Priority:
 Medium
-
None
-
Affects Version/s: 5.4.3
-
Component/s: None
-
None
-
Environment:Debian GNU/Linux 10 (buster) 4.19.0-10-amd64 #1 SMP Debian 4.19.132-1 (2020-07-24) x86_64 GNU/Linux
Steps to reproduce:
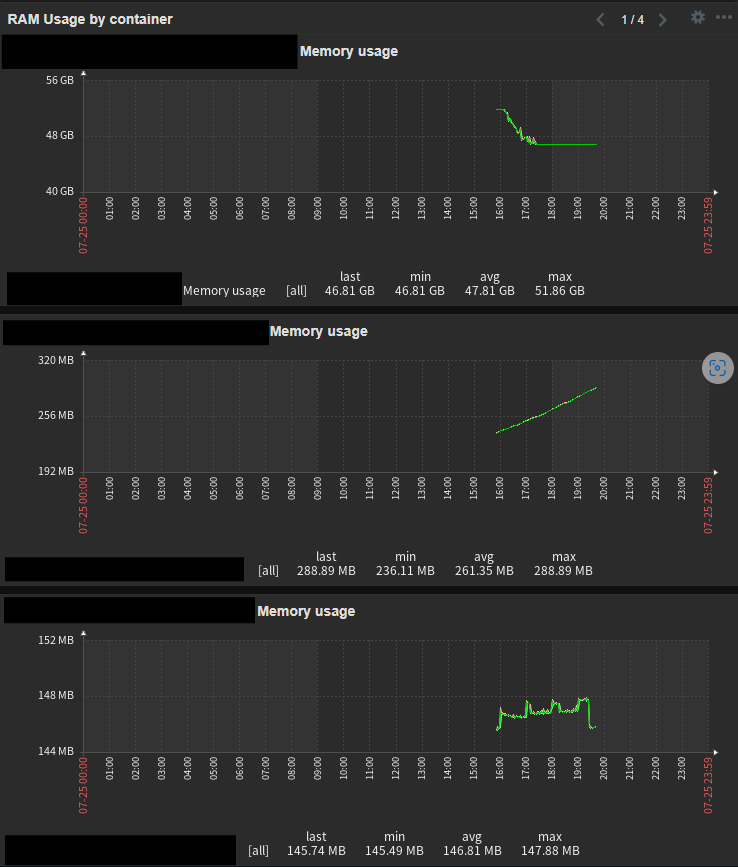
- We've got a docker logrotate container which is rotating a specific path with logs every day at midnight using cron
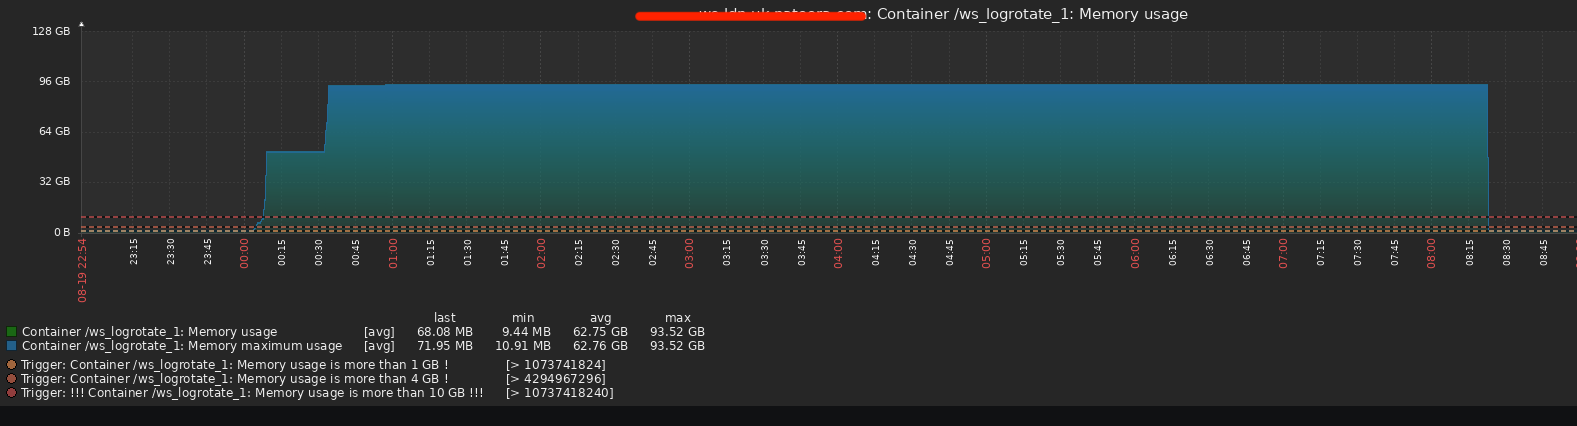
- At midnight the container memory usage spiked from 63Mib to 93Gib in a few min.
- Zabbix was still showing in graphs the "last" is still 93Gib even after 9 hours after the container spiked
- Also i received an email as an alert, if it is more than 10 GB we receive an alert.
- Now (after 9h) i went on the server and ran "docker stats" and the mem usage for that container was 63Mib but on the Zabbix graph was still showing me 93Gib
- After i restarted the container, the zabbix graphs started to show the correct numbers same as the "docker stats"
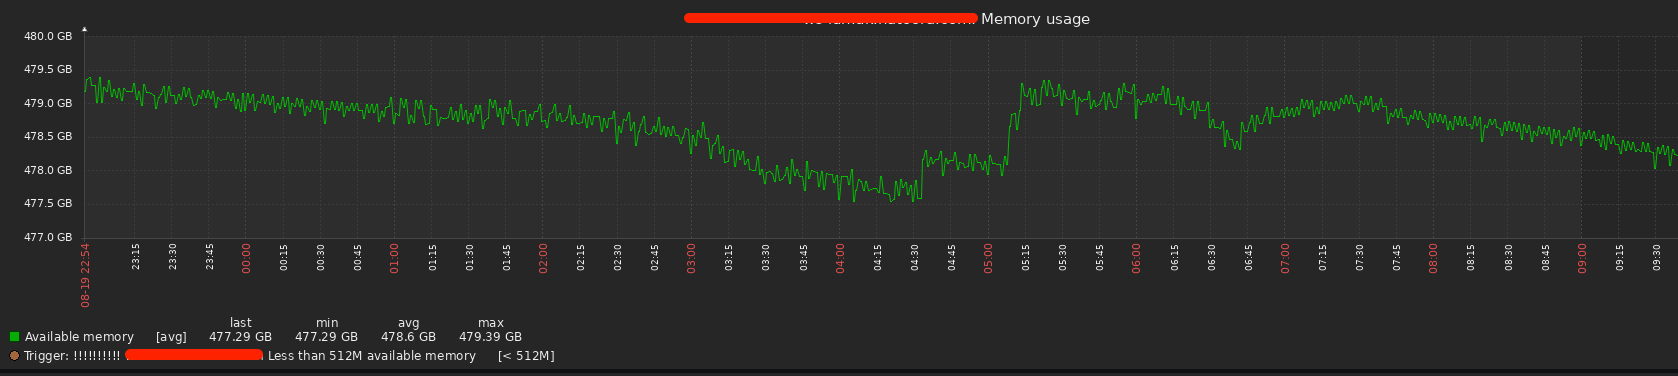
- Also, the total memory of the server didn't spiked or changed so i think those 93GiB are not real
- Usually when we have other containers spiking in memory then the total memory of the server is spiking as well means it is taking from the total memory of the host
Result:
In one screenshot you see the total memory of the VM that is not spiking 93GiB in memory
The other screenshot you see the container spiking to 93 Gib in memory and not releasing until i restarted
However docker stats showed 63MiB at that time (i don;t have screenshot for this)
Expected:
I expect to see in Zabbix Graphs the same numbers as "docker stats"