-
Type:
New Feature Request
-
Resolution: Unresolved
-
Priority:
 Trivial
-
None
-
Affects Version/s: None
-
Component/s: None
-
None
Hello Zabbix Team
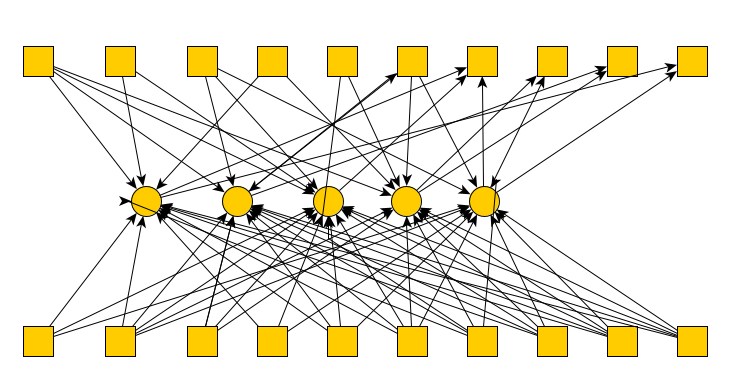
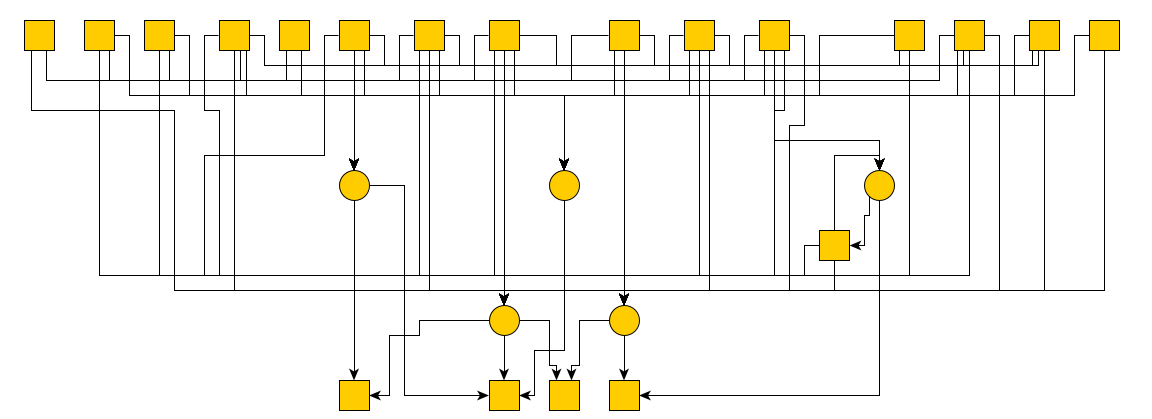
We use Zabbix Maps to visualize our customer systems, Zabbix map is very useful for that, so we can see when a central system goes down, which customers are affected and etc.
our problem is that we have more than 100 customers, more than 500 hosts and about 50 central systems, and if we add a link between two elements, it is very confusing and not nice.
I should somehow find a solution in Zabbix Maps for our customer map to display everything clearly and nicely. For this I added three pixel image between two elements to create a flowchart layout (ScreenShot). This was a very hard and annoying work.
If we have the ability to edit the edge(link) between two elements and have different layouts, it would make Zabbix Maps much more popular.
Best regards
Hadi
PS: i have uploaded screenshots in case my feature request is not clear enough.