-
Type:
Change Request
-
Resolution: Fixed
-
Priority:
 Trivial
-
Affects Version/s: None
-
Component/s: None
-
None
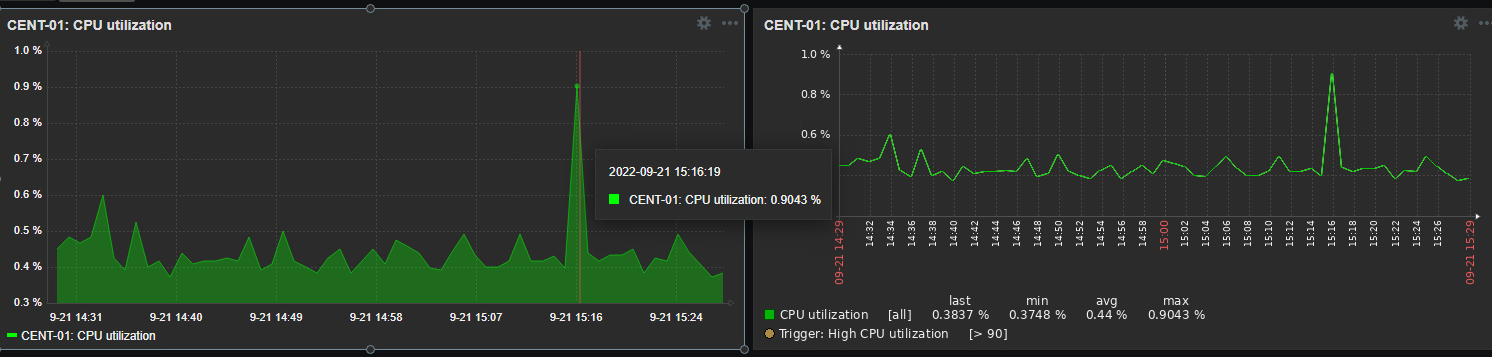
The "new" graph widget is very usefull and can give a lot of information. when you hover over with your mouse you can see the data of the given time. the "older" Graphs that you can use in templates are limted. I would like to be able to add the newer graphs to template dashboards, that way when i use my main dashboard and click on a linux host I can view the more advanced graphs. Now if i want graphs of all my hosts i need to make a dashboard/page for them manually.
On the screenshot you see the new graph on the left and the old one on the right. on templates for example (Linux by Zabbix agent) you can only add the old graphs currenlty.