Readability of Graph (new) widget - X Axis Time period

XMLWordPrintable

    • Type: Change Request
    • Resolution: Unresolved
    • Priority: Medium
    • None
    • Affects Version/s: 6.4.4
    • Component/s: Frontend (F)
    • None

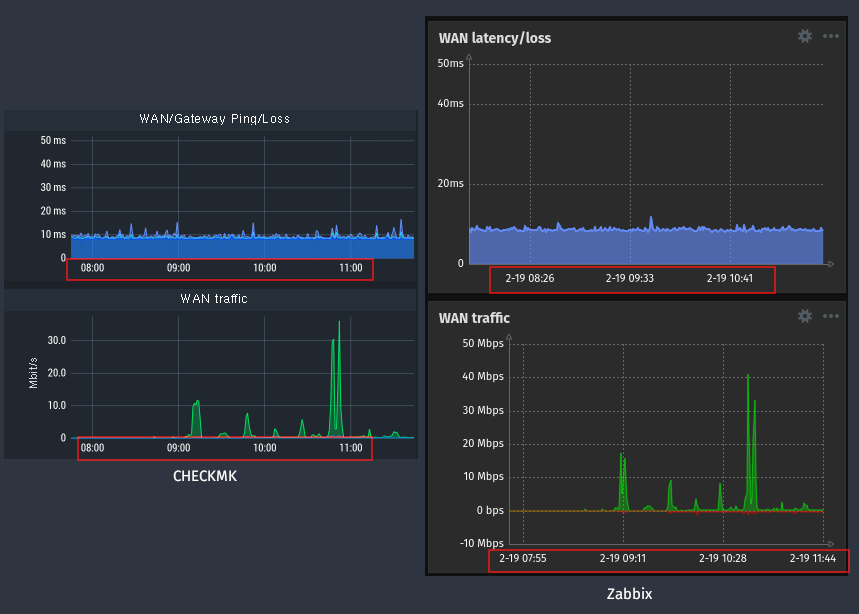
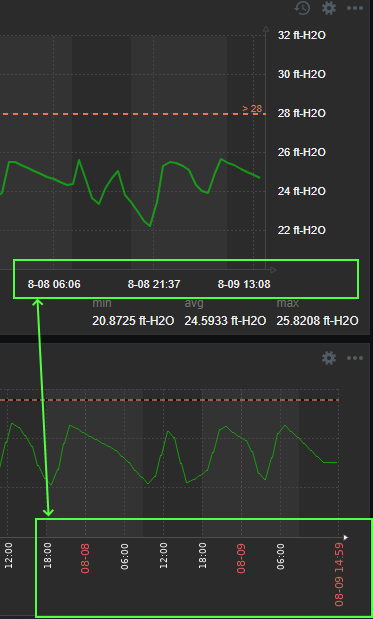
      The classic graph widget shows a grid that align with full hours, and shows the time tick labels as hour:00

      The new graph widget arbitrarily chooses the labels and grid alignment making the graph more difficult to read than the old style.

      https://www.zabbix.com/forum/zabbix-troubleshooting-and-problems/440049-x-axis-time-interval-in-widget-graphs-arbitrary

        1. graph-x-axis.png
          61 kB
          Kevin Elmore
        2. screenshot-1.png
          29 kB
          Kevin Elmore

            Assignee:
            Valdis Murzins
            Reporter:
            Kevin Elmore
            Votes:
            6 Vote for this issue
            Watchers:
            8 Start watching this issue

              Created:
              Updated: