-
Type:
New Feature Request
-
Resolution: Fixed
-
Priority:
 Minor
Minor
-
None
-
Affects Version/s: 6.4.12
-
Component/s: Frontend (F)
-
None
Hi!
To reproduce considered issue, a history dataset can be imported by command to a Test/test.key host/key:
zabbix_sender -i data.txt -T -z 127.0.0.1
When you editing a graph widget, making it more short/long, with each wide-step (exactly 71 pixels, but it may depend, supposedly), frontend is doing a background HTTP POST request to URL:
zabbix.php?sid=XXXX&action=widget.svggraph.view
with a payload as:
  "dashboardid": "174",
  "widgetid": "3104",
  "fields": "{\"ds.hosts.0.0\":\"Test\",\"ds.items.0.0\":\"Test KEY\",\"source\":\"1\",\"righty\":\"0\"}",
  "view_mode": "0",
  "edit_mode": 1,
  "content_width": 487,
  "content_height": 230,
  "from": "2024-02-25 08:26:15",
  "to": "2024-02-25 18:56:28"
where the only difference is a number for "content_width": 487
This cause a set of SQLs performed, where we are interested in only one, like this:
SELECT itemid,COUNT(*) AS count,AVG(value) AS avg,MIN(value) AS min,MAX(value) AS max,round(487*(CAST(clock AS UNSIGNED)-1708842375)/37813,0) AS i,MAX(clock) AS clock FROM history_uint WHERE itemid='59361' AND clock>='1708842375' AND clock<='1708880188' GROUP BY itemid,round(487*(CAST(clock AS UNSIGNED)-1708842375)/37813,0)
where the same number 487 is used in 2 places.
Considering 487's request, which produces 487 rows of data, where in the middle we can find this:
+--------+-------+--------+------+------+------+------------+
| itemid | count | avg    | min  | max  | i    | clock      |
+--------+-------+--------+------+------+------+------------+

|  59361 |     2 | 1.0000 |    1 |    1 |  193 | 1708857386 |
|  59361 |     1 | 1.0000 |    1 |    1 |  194 | 1708857446 |
|  59361 |     1 | 2.0000 |    2 |    2 |  195 | 1708857506 |
|  59361 |     2 | 1.0000 |    1 |    1 |  196 | 1708857626 |
|  59361 |     1 | 1.0000 |    1 |    1 |  197 | 1708857686 |
while one-step-less wide graph requests 416 rows cast, where a middle part returned as:
+--------+-------+--------+------+------+------+------------+
| itemid | count | avg    | min  | max  | i    | clock      |
+--------+-------+--------+------+------+------+------------+

|  59361 |     2 | 1.0000 |    1 |    1 |  164 | 1708857326 |
|  59361 |     1 | 1.0000 |    1 |    1 |  165 | 1708857386 |
|  59361 |     2 | 1.5000 |    1 |    2 |  166 | 1708857506 |
|  59361 |     1 | 1.0000 |    1 |    1 |  167 | 1708857566 |
|  59361 |     2 | 1.0000 |    1 |    1 |  168 | 1708857686 |
here is the difference - 2.0 vs 1.5 value for a single row.
This exactly causing this graph:
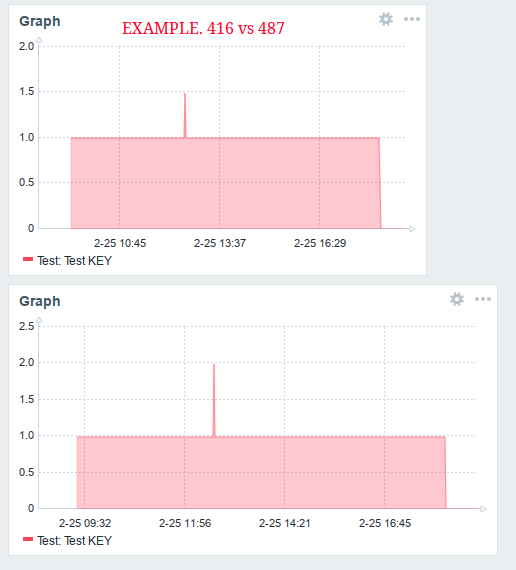
That's an issue for zabbix users.
This reminded me about classic graphs (PNG), where we have a dedicated setting - Function, where it's possible to select one of all/min/avg/max what to use for rendering.
https://www.zabbix.com/documentation/6.4/en/manual/config/visualization/graphs/custom
Such an option could be implemented for modern/vector graphs, which would help to avoid cases as described.
