-
Type:
Change Request
-
Resolution: Unresolved
-
Priority:
 Medium
-
None
-
Affects Version/s: 7.0.0beta3
-
Component/s: Frontend (F)
-
None
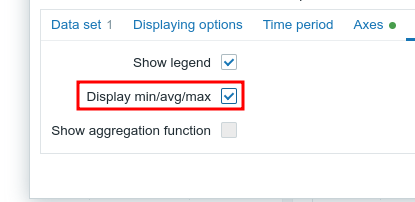
Our current vector graphs provide the option to enable data aggregation for the displayed history period:

However it doesn't show the latest values, that are available in classic graphs:
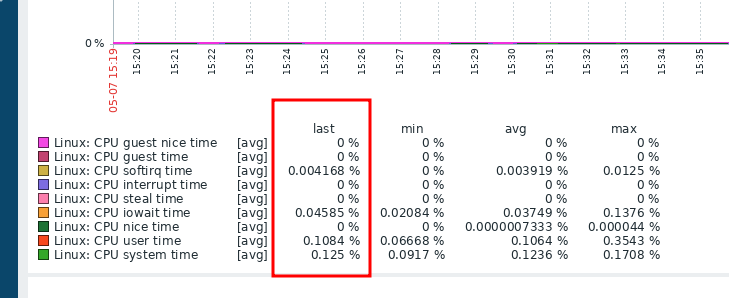
It is useful and it would be nice to have this in vector graphs (maybe some other widgets are missing this as well).
- duplicates
-
ZBXNEXT-5516 Dashboard new Graph widget legend extended functionality
-
- Open
-
- is duplicated by
-
-

- Open
-