-
Type:
Change Request
-
Resolution: Fixed
-
Priority:
 Trivial
-
Affects Version/s: None
-
Component/s: Frontend (F)
-
Prev.Sprint, S25-W34/35, S25-W36/37, S25-W38/39, S25-W40/41, S25-W42/43, S25-W44/45, S25-W48/49
-
14
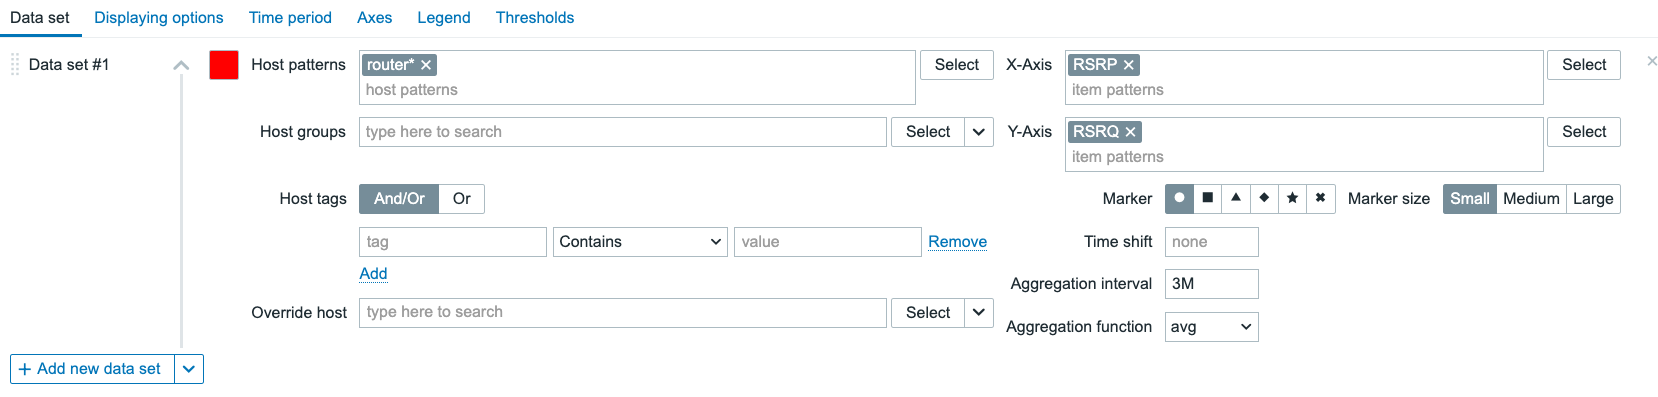
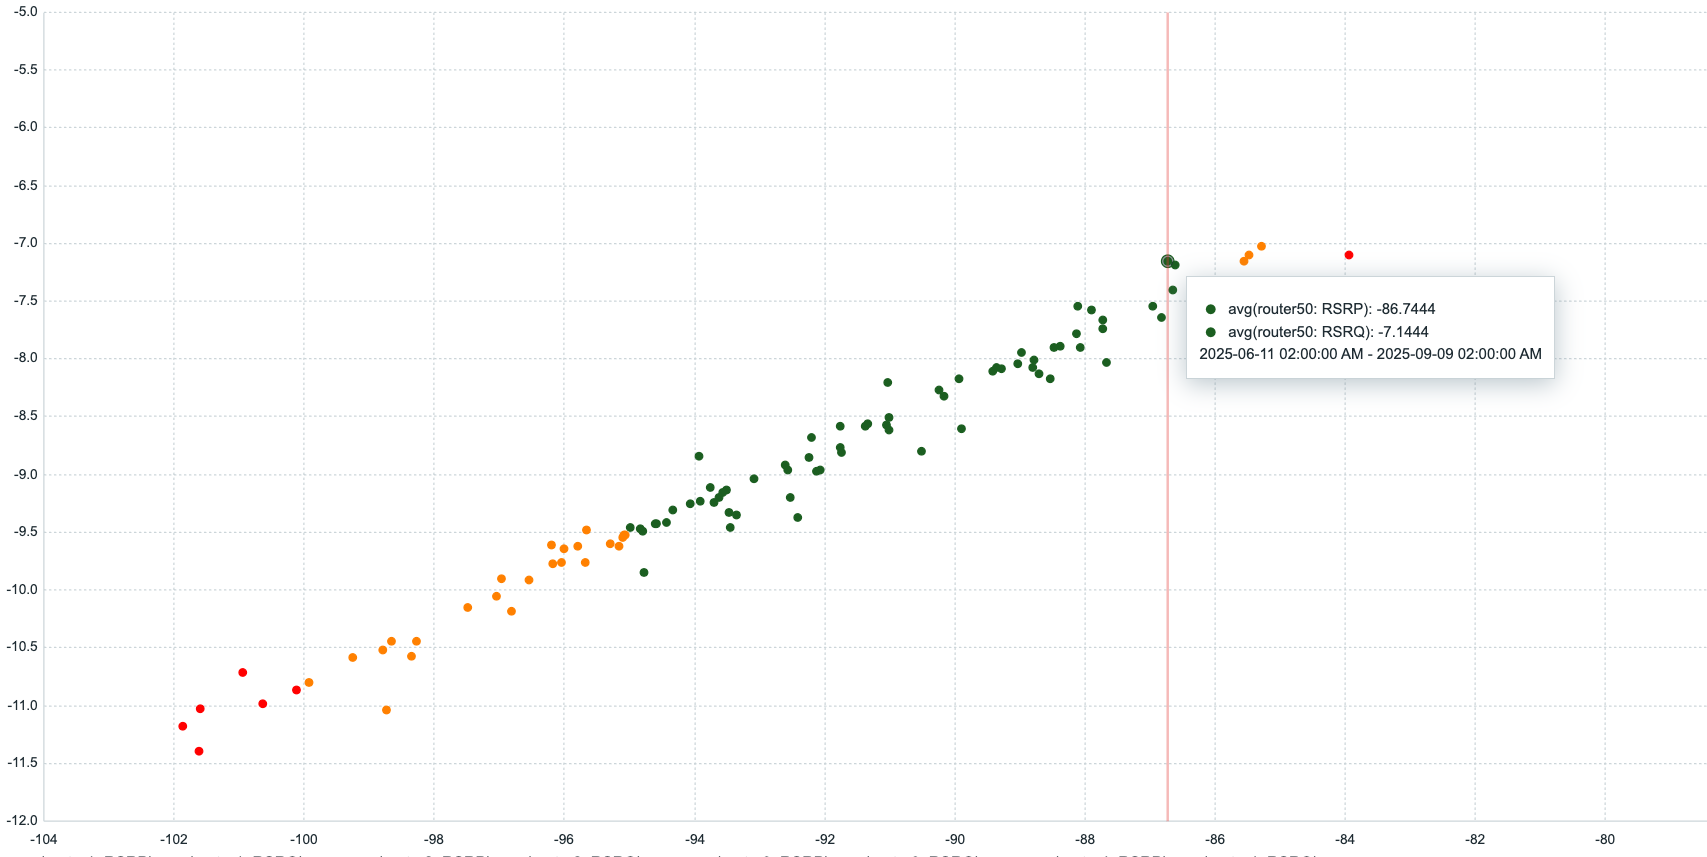
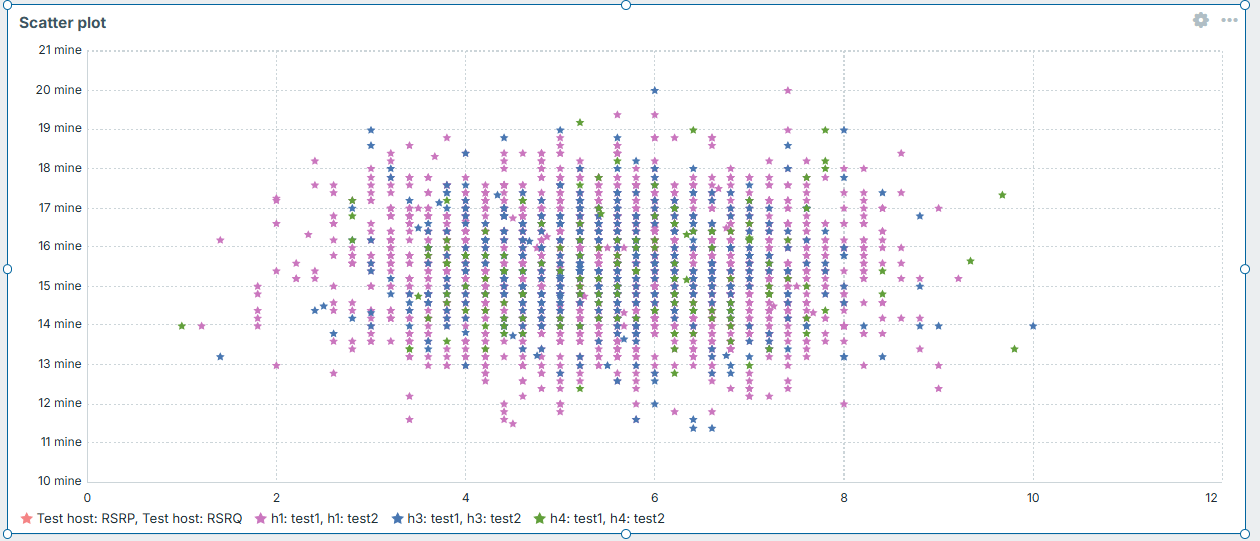
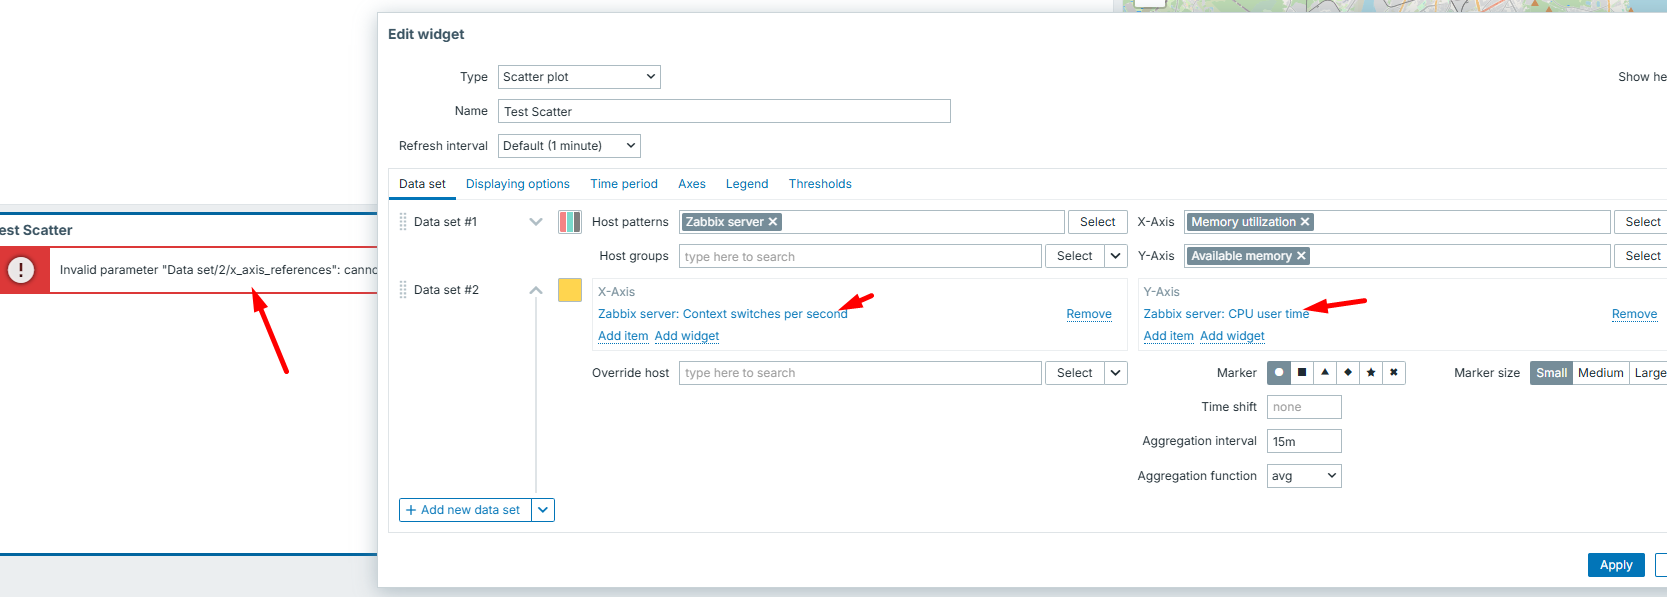
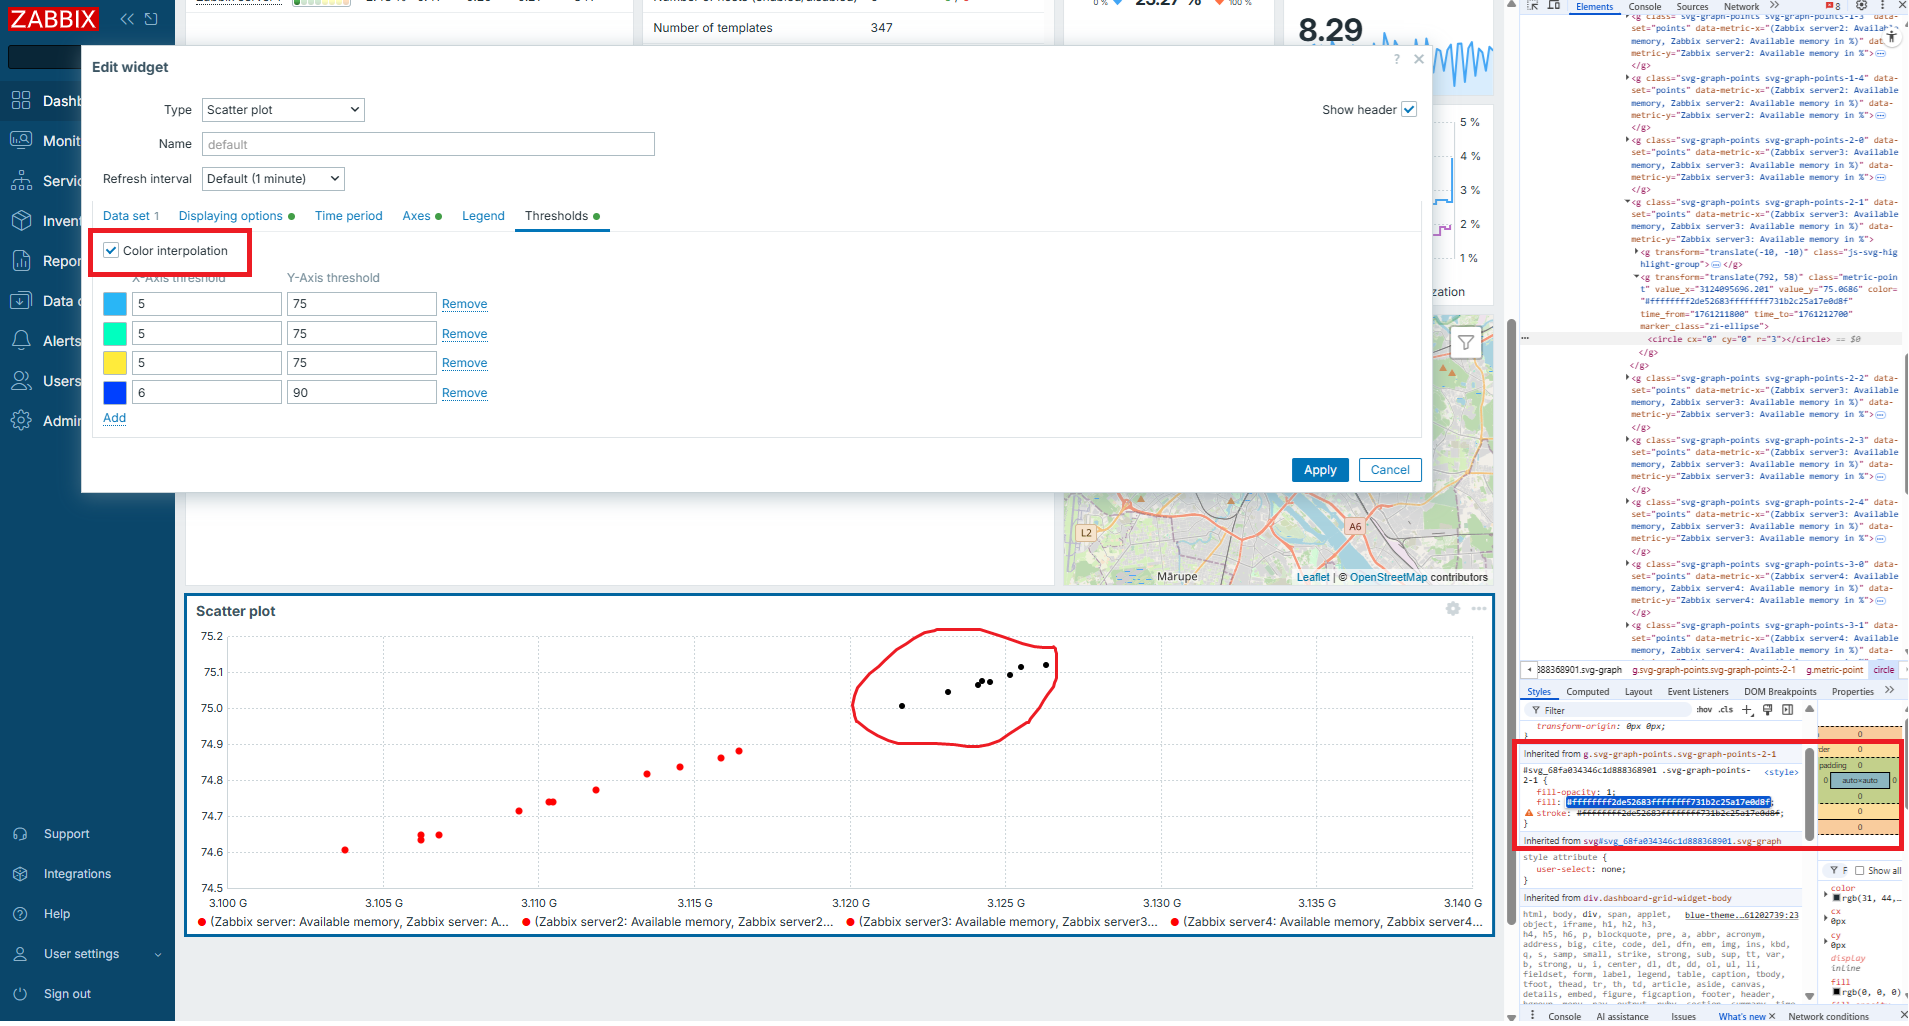
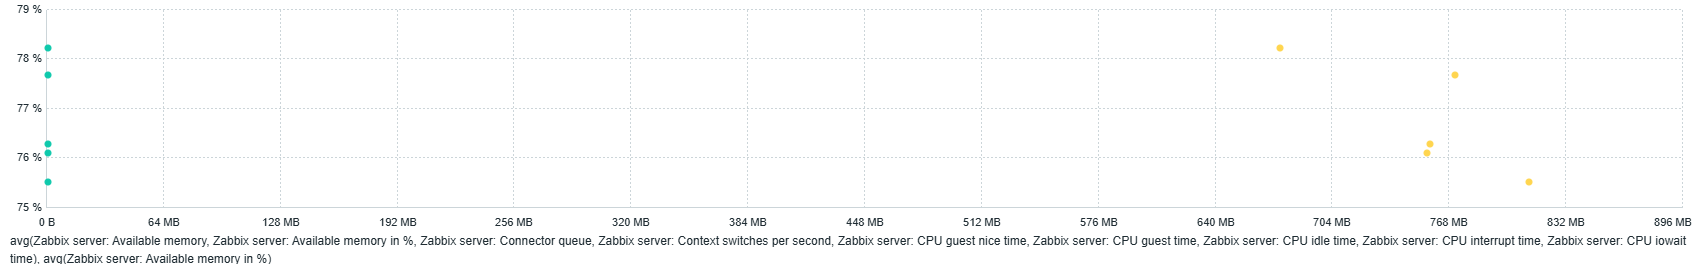
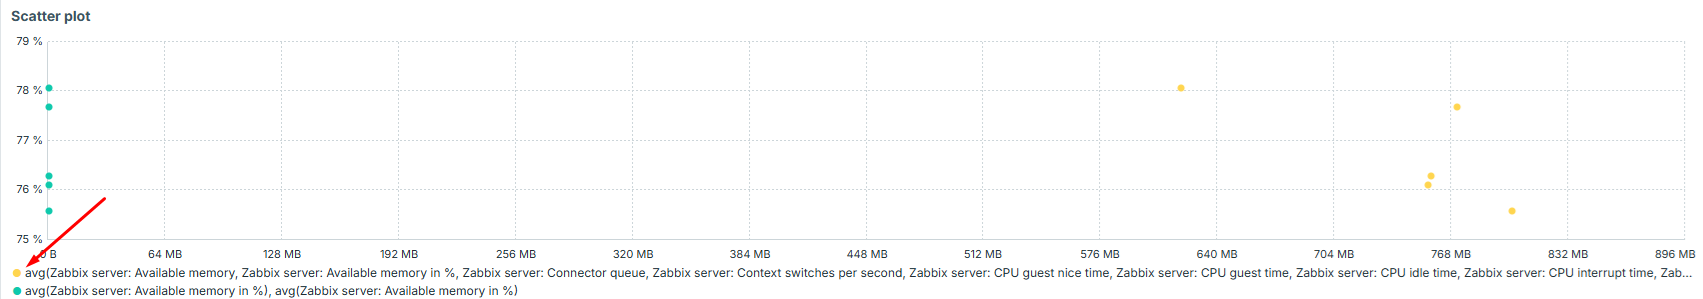
As a user I would like to have an enhanced view on data visualised in a scatterplot (https://en.wikipedia.org/wiki/Scatter_plot)
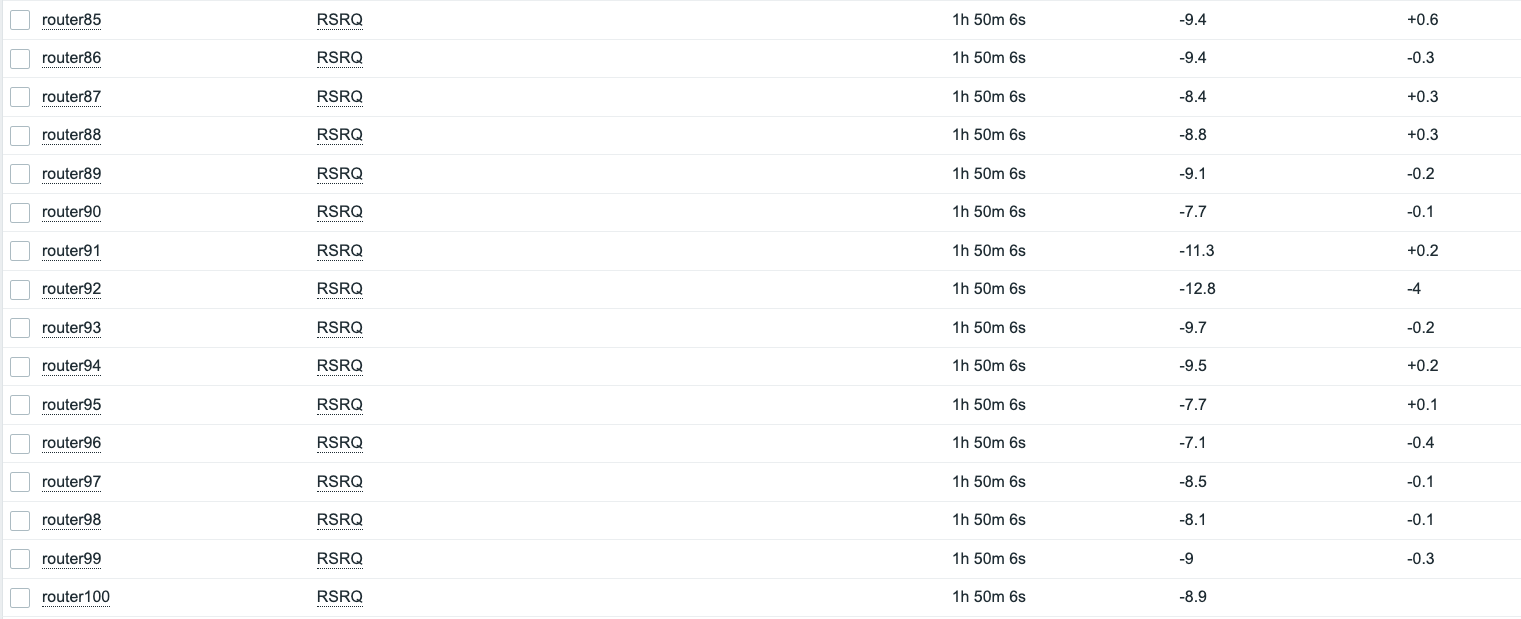
Use case: In zabbix we get RSRP and RSRQ ( https://wiki.teltonika-networks.com/view/RSRP_and_RSRQ ) data, which currently is hard to visualize. It would be useful to get the data plotted and have the thresholds defined in the plot.