-
Type:
Change Request
-
Resolution: Unresolved
-
Priority:
Trivial
-
None
-
Affects Version/s: 7.0.4
-
Component/s: Frontend (F)
-
None
Hi! We use this widget frequently, but there are some limitations.
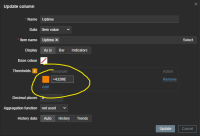
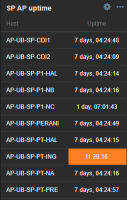
In the "Thresholds" configuration for each column, I’d like the option to set a color for values lower than a given number, not just for those higher. For example, I’d like to apply a specific color to uptime values lower than 12 hours. This feature could also be useful for other metrics, such as pressure, temperature, etc.
I also believe it would be helpful to have the ability to split hosts into multiple columns, rather than just one. Automatically distributing hosts across multiple columns in the same widget avoids the need to create multiple widgets with different selected hosts for a side-by-side view.
Additionally, the current "Host Limit" of 100 hosts is quite low, and in many cases, it's necessary to add multiple widgets and manually select the hosts for each one.


