-
Type:
Change Request
-
Resolution: Unresolved
-
Priority:
 Minor
Minor
-
None
-
Affects Version/s: 7.0.9
-
Component/s: Frontend (F)
-
None
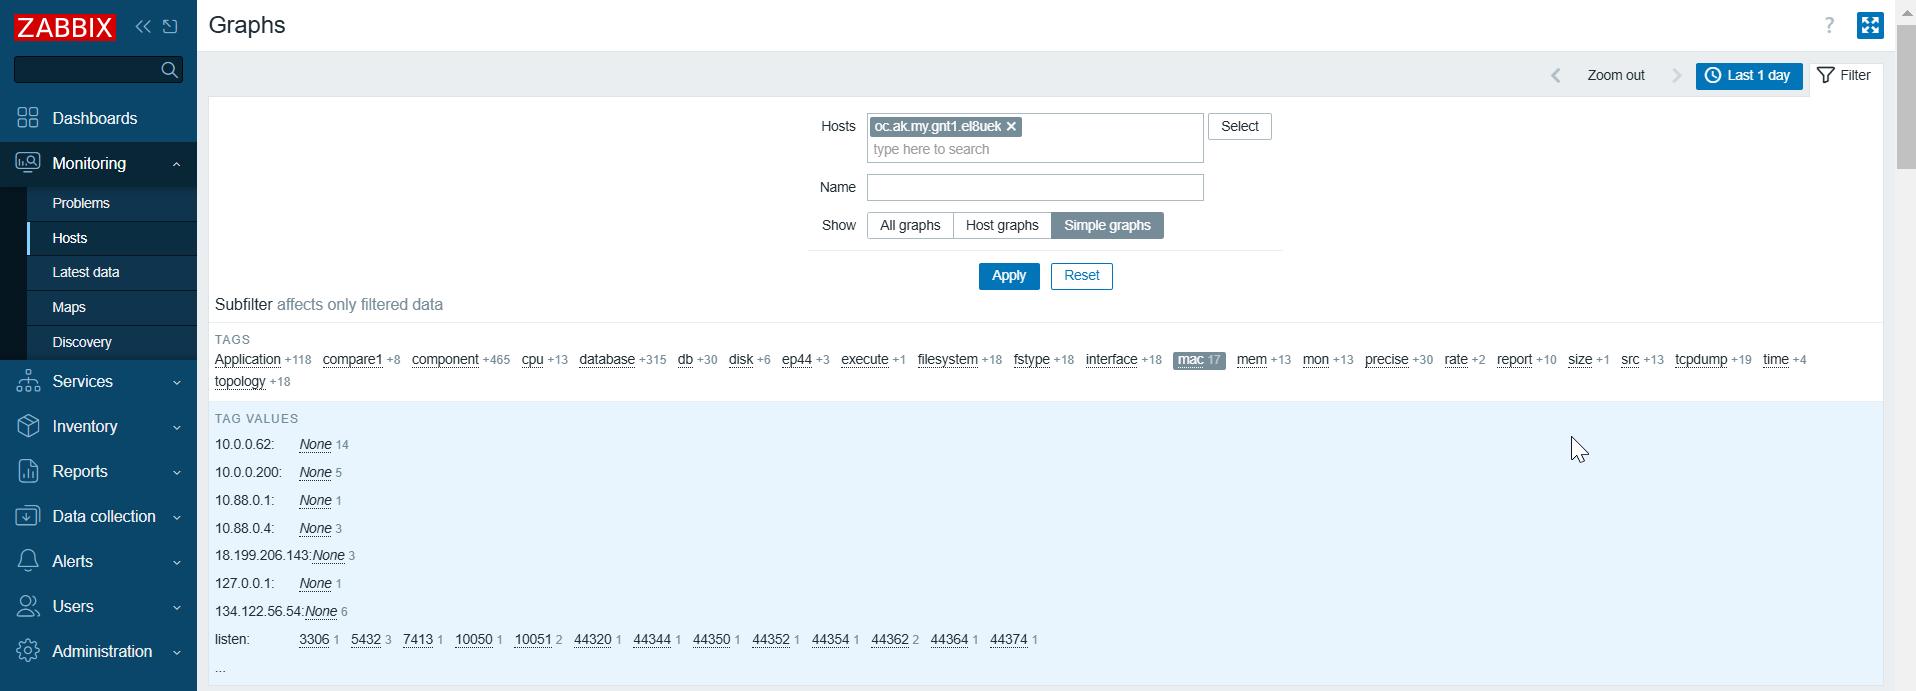
The section "Monitoring" => "Hosts" => "Graphs" => "Filter" => "Simple graph" generates a graph for every numerical data point. The screen offers many tags (and tag values) as a navigation.
It's not possible to expand the list in full:
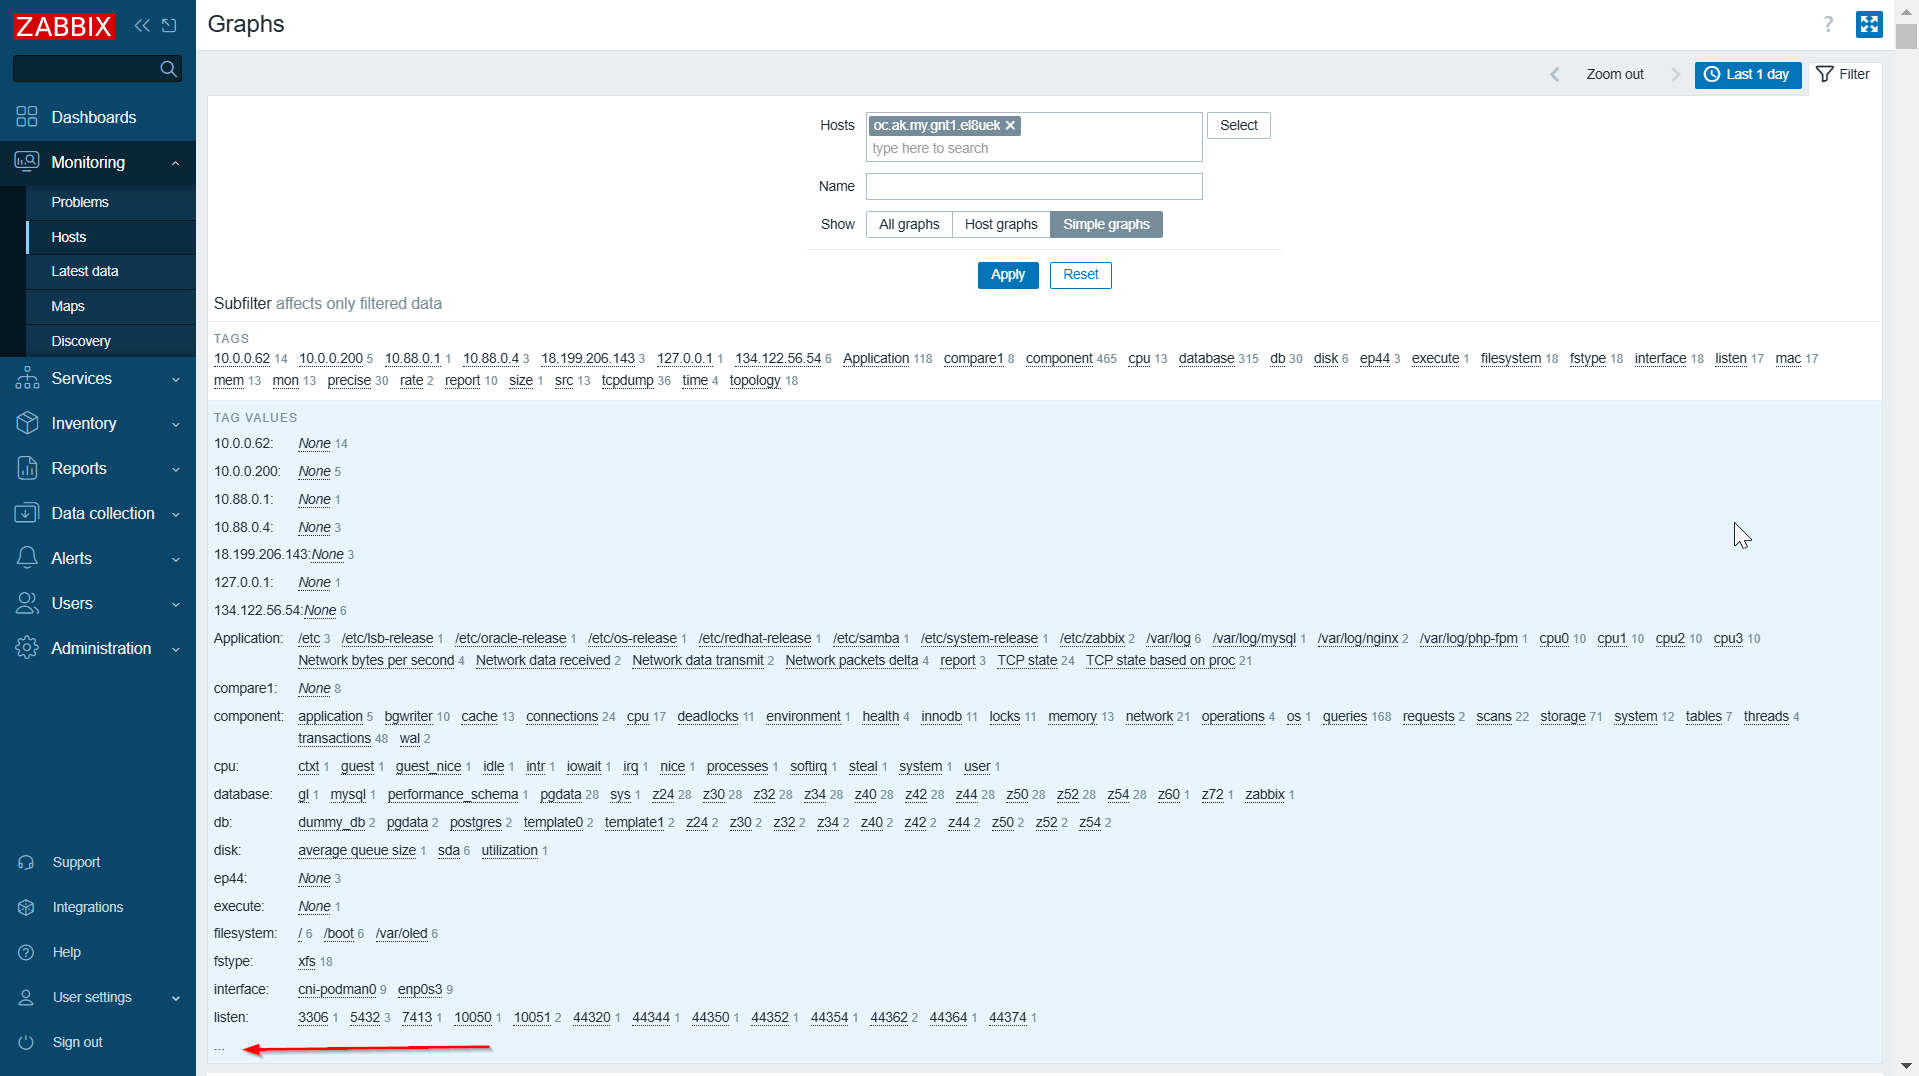
A workaround to select only the tag name (selecting "mac" in the example) also not reveal all tag values (17 different tag values in example):

At the moment, this behaviour is by design. From documentation:
Vertical lists (such as tags with their values) are limited to 20 entries. If there are more, a three-dot icon is displayed; it is not clickable.