|
Duplicate |
|||
|
Sub-task |
|||
| depends on |
|
TimescaleDB 2.0 changes are not compa... | Closed |

[ZBX-16347] Postgresql out of memory using timescaledb Created: 2019 Jul 06 Updated: 2024 Apr 10 Resolved: 2020 Jun 04 |
|
| Status: | Closed |
| Project: | ZABBIX BUGS AND ISSUES |
| Component/s: | Server (S) |
| Affects Version/s: | 4.2.4 |
| Fix Version/s: | 4.4.9rc1, 5.0.1rc1, 5.2.0alpha1, 5.2 (plan) |
| Type: | Problem report | Priority: | Major |
| Reporter: | Aaron Whiteman | Assignee: | Artjoms Rimdjonoks |
| Resolution: | Fixed | Votes: | 34 |
| Labels: | TimescaleDB | ||
| Remaining Estimate: | Not Specified | ||
| Time Spent: | Not Specified | ||
| Original Estimate: | Not Specified | ||
| Environment: |
Db: CentOS Linux 7, Postgresql 11.4, timescaledb-11-1.2.2 |
||
| Attachments: |
|
||||||||||||
| Issue Links: |
|
||||||||||||
| Team: | |
||||||||||||
| Sprint: | Sprint 63 (Apr 2020), Sprint 64 (May 2020) | ||||||||||||
| Story Points: | 1 | ||||||||||||
| Description |
|
Steps to reproduce:
Result:
When this occurs, the history syncer processes do not update history and the database/server falls behind, generating multiple triggers and alerts. See log file...
Note: this appears to be the same issue reported in |
| Comments |
| Comment by Andrei Gushchin (Inactive) [ 2019 Jul 10 ] | |||||||||||||||||||||||||||
|
It looks like more timescale issue. It uses memory for achieving faster inserting with a comparison with Postgres, then it flushes data to DB. | |||||||||||||||||||||||||||
| Comment by Aaron Whiteman [ 2019 Jul 10 ] | |||||||||||||||||||||||||||
|
Andrei, it may indeed be timescaledb, or it could be a behavior of pgsql when presented a large sequence of update queries (see the previously reported This issue is pretty critical to us; the end result is that we need to throw out data to recover because the update queries clock up the data insertion streams and new data can't be inserted until they complete. In some cases, we've seen delays that last several hours. For the moment, we are more concern about determining a workaround than a true fix; if there's an action we can take to prevent the issue from occurring after the zabbix server process is restarted, then we could implement that action. | |||||||||||||||||||||||||||
| Comment by Aaron Whiteman [ 2019 Jul 29 ] | |||||||||||||||||||||||||||
|
This week, we will be restarting the zabbix server due to patching requirements. Do you have a suggestion on what we can do to avoid or mitigate the UPDATE query sequence that clobbers our database performance/usage and results in significant delays regarding importing new data from our proxies?
Again, this is not new behavior, based on the long closed (WONTFIX) issue | |||||||||||||||||||||||||||
| Comment by Andrei Gushchin (Inactive) [ 2019 Aug 30 ] | |||||||||||||||||||||||||||
|
Aaron, thank you for the detailed update. | |||||||||||||||||||||||||||
| Comment by Aaron Whiteman [ 2019 Aug 30 ] | |||||||||||||||||||||||||||
|
Andrei, based on a quick read of the code (and my very dated memories of C), I think the reason we only see this on a restart is due to the way the flush happens: trend cache flushes happen at two times:
In either case, any trend data is written to the database. During trend writes, the trend write
During normal operations (no restart), there is never an UPDATE, because the data is always new. When the server shuts down, there's no UPDATE,because the data is new. It's only the first time the trend cache is flushed after a reboot that we try to do the UPDATE statements.
I believe but have not verified that what happens when we send a large number of ; separated UPDATE commands in a single statement is that pgsql runs all of the updates simultanously, resulting in a large memory usage (and crashes due to OOM). If this is the case, then yes running the updates sequentially rather than all at once would likely be an improvement. That said, what would be even better is a way that the trend writes could be separated from the regular item data writes; our real problem is that when the trend UPDATE writes occur, all four of our database syncers get clogged an no data gets written until they are complete—end result: lots and lots of alerts that aren't real. We have an environment with 1,120,000 items (roughly 12k vps), so when a db_syncer is blocked for minutes at a time, it backs up quickly. | |||||||||||||||||||||||||||
| Comment by Tim Thompson [ 2019 Sep 25 ] | |||||||||||||||||||||||||||
|
For what it's worth, I have this exact same issue since making the switch to timescaledb. On zabbix startup, 4 processes start pushing large UPDATEs and oom-killer eventually takes them all out. This cycles for a while but eventually sorts itself out. | |||||||||||||||||||||||||||
| Comment by Guillaume [ 2019 Oct 16 ] | |||||||||||||||||||||||||||
|
We have the exact same problem here.
If I disable all hosts, and enable them again, it's working again, but maybe will break again after one hour. | |||||||||||||||||||||||||||
| Comment by Andrei Gushchin (Inactive) [ 2019 Oct 17 ] | |||||||||||||||||||||||||||
|
[email protected] Do you have the same during start? and you have the proxies as well? Could anyone you share the proxy stats from Administration proxies? I'm interesting on a number of items, hosts and NVPS. | |||||||||||||||||||||||||||
| Comment by Guillaume [ 2019 Oct 17 ] | |||||||||||||||||||||||||||
|
For now, I only have issue during start, I do not have issue once an hour (I still have housekeeper running each hour). I have only 3 proxy, and only 1 updated 4.4 for now (the 2 other are waiting for package update on pfsense), so only 1 running. Regarding this proxy running:
| |||||||||||||||||||||||||||
| Comment by Tim Thompson [ 2019 Oct 17 ] | |||||||||||||||||||||||||||
|
Single proxy. My issue only occurs during startup.
| |||||||||||||||||||||||||||
| Comment by Aaron Whiteman [ 2019 Oct 17 ] | |||||||||||||||||||||||||||
|
We have been working around this issue using the following process when we need to update the software on our zabbix server or reboot. We don't care for the process, because we are intentionally losing data, but it seems to be the best path to get our zabbix server back into a consistent state ready to read data.
That said, I often run in to a different bug: | |||||||||||||||||||||||||||
| Comment by Mark Moses [ 2019 Oct 28 ] | |||||||||||||||||||||||||||
|
I have had a similar issue with postgresql 10.6 ( RHEL software collection) and timescaledb 1.4.2. With help of zabbix support my installation just survived 2 rounds of trend updates on the whole hour ( restarted zabbix_server in between to trigger the update queries) so I feel these step might benefit you as well. The first thing to be done is preventing memory over commits by adding the following into /etc/sysctl.conf: ``` vm.overcommit_memory=2 ```
Next turn on huge pages by adding a line with vm.nr_hugepages=XXX in /etc/sysctl.conf. The XXX are the number of huge pages the system should create. You can find that number by following the steps in section 18.4.5 on this page: https://www.postgresql.org/docs/10/kernel-resources.html. To be sure postgresql uses huge pages you can edit postgresql.conf and set huge_pages = on ( default is try). If it cannot use huge pages postgresql won't start. So it's easy to tell.
You can activate the kernel settings by rebooting. ( Others ways as well but I'm trying to keep it simple). To check after reboot you can use: ``` sysctl -a | grep -e vm.overcommit_memory -e vm.nr_hugepages ```
I also found that timescaledb-tune gave me way too high numbers for work_mem. This script can help identifying if your memory settings allocate more memory than you have system RAM available: https://raw.githubusercontent.com/jfcoz/postgresqltuner/93b48c262dc1c2dfc675df78b286584bb1331574/postgresqltuner.pl. According to that script my PostgreSQL maximum usage is now at 84.80% of system RAM on a 32GB shared app/db server.
I'm actually pretty curious if these steps help others as well so update the ticket with your experience if you decide to give this a try. | |||||||||||||||||||||||||||
| Comment by Oleksii Zagorskyi [ 2019 Oct 29 ] | |||||||||||||||||||||||||||
|
I've to say that wsuzabbixapw is absolutely right in understanding how zabbix server behaves with trends, regarding INSERTs and UPDATEs. Still, it's obvious that issue is with timescale, not zabbix. | |||||||||||||||||||||||||||
| Comment by Mark Moses [ 2019 Oct 29 ] | |||||||||||||||||||||||||||
|
To be complete my earlier comment on resolving the issue wasn't really correct. I was so used to seeing the DB go down that I was just looking for that. Closer inspection in the log did reveal that now that the DB stays up the UPDATE statements themselves fail with an OOM error.
Today I've experimented with several more settings. None of them actually worked but I'll document them here for completeness: I've turned on: timescaledb.max_open_chunks_per_insert=1
I also tried if this issue was related: https://github.com/timescale/timescaledb/pull/1447. For this I've compiled a timescaledb plugin from the master branch (last commit 3ad6a5c). I've also tried decreasing shared_buffers in favor of more work memory while keeping the max memory consumption under 90% as reported by postgresqltuner.pl (see previous comment for a link to that script)
| |||||||||||||||||||||||||||
| Comment by Denis Filinkov [ 2019 Nov 24 ] | |||||||||||||||||||||||||||
|
i have same iisue debian 10 postgresql 11 timescaldb 1.5.1 postgresql eat all off memory if all proxys connection down for 30 minutes snt then send all data to server | |||||||||||||||||||||||||||
| Comment by Andrei Gushchin (Inactive) [ 2019 Nov 25 ] | |||||||||||||||||||||||||||
|
Hello Denis, Thank you for the info. I tried to reproduce, scenarios were. Could you as well please attach the cause of the problem query to the ticket? | |||||||||||||||||||||||||||
| Comment by Denis Filinkov [ 2019 Nov 25 ] | |||||||||||||||||||||||||||
|
DB is fresh =) about 30GB i have +6GB for a day NVPS for server 527 for proxy from 1 to 70 nvps hypertable settings is 2 hours
I figured out about the problem if you restart the zabbix-server while the zabbix-server is running, then most likely the postgres will start eating memory
resolved if i stop zabbix and proxy, then start postgres, then wait for 2 minutes, then start zabbix-server i have 6 cores and 32 GB RAM
| |||||||||||||||||||||||||||
| Comment by Oleksii Korolov [ 2019 Nov 26 ] | |||||||||||||||||||||||||||
|
Greetings, Gentlemen, First of all I would like to mention that the text below is not directly related to TimescaleDB, so please, discard this comment if you think it is not relevant, but in our team we tend to think that TimescaleDB itself is not itself the root cause, as well the issue is not directly related to Zabbix. We assume that it is more related to
One of the pre-requisites is a populated DB. It is unlikely to face the issue on a fresh DB in our case. TopMemoryContext: 1327912 total in 26 blocks; 483824 free (1519 chunks); 844088 used TopTransactionContext: 8192 total in 1 blocks; 7768 free (3 chunks); 424 used pgstat TabStatusArray lookup hash table: 57344 total in 3 blocks; 22696 free (6 chunks); 34648 used PL/pgSQL function context: 57344 total in 3 blocks; 14640 free (3 chunks); 42704 used PL/pgSQL function context: 57344 total in 3 blocks; 14640 free (3 chunks); 42704 used Btree proof lookup cache: 8192 total in 1 blocks; 776 free (0 chunks); 7416 used PL/pgSQL function context: 57344 total in 3 blocks; 14640 free (3 chunks); 42704 used PL/pgSQL function context: 57344 total in 3 blocks; 14640 free (3 chunks); 42704 used Type information cache: 24472 total in 2 blocks; 2840 free (0 chunks); 21632 used PLpgSQL cast info: 8192 total in 1 blocks; 8072 free (0 chunks); 120 used PLpgSQL cast cache: 8192 total in 1 blocks; 1800 free (0 chunks); 6392 used PL/pgSQL function context: 57344 total in 3 blocks; 14560 free (2 chunks); 42784 used CFuncHash: 8192 total in 1 blocks; 776 free (0 chunks); 7416 used Rendezvous variable hash: 8192 total in 1 blocks; 776 free (0 chunks); 7416 used PLpgSQL function cache: 24528 total in 2 blocks; 2840 free (0 chunks); 21688 used TableSpace cache: 8192 total in 1 blocks; 2312 free (0 chunks); 5880 used Operator lookup cache: 24576 total in 2 blocks; 10976 free (5 chunks); 13600 used MessageContext: 3474997304 total in 426 blocks; 19856 free (10 chunks); 3474977448 used Operator class cache: 8192 total in 1 blocks; 776 free (0 chunks); 7416 used smgr relation table: 253952 total in 5 blocks; 30456 free (17 chunks); 223496 used TransactionAbortContext: 32768 total in 1 blocks; 32728 free (0 chunks); 40 used Portal hash: 8192 total in 1 blocks; 776 free (0 chunks); 7416 used PortalMemory: 8192 total in 1 blocks; 8152 free (1 chunks); 40 used Relcache by OID: 122880 total in 4 blocks; 46784 free (9 chunks); 76096 used CacheMemoryContext: 8380416 total in 10 blocks; 1541136 free (4 chunks); 6839280 used ...---... WAL record construction: 49768 total in 2 blocks; 6584 free (0 chunks); 43184 used PrivateRefCount: 8192 total in 1 blocks; 2840 free (0 chunks); 5352 used MdSmgr: 57344 total in 3 blocks; 12944 free (1 chunks); 44400 used LOCALLOCK hash: 516096 total in 6 blocks; 193824 free (21 chunks); 322272 used Timezones: 104120 total in 2 blocks; 2840 free (0 chunks); 101280 used ErrorContext: 8192 total in 1 blocks; 8152 free (4 chunks); 40 used Grand total: 3487648744 bytes in 1694 blocks; 2944136 free (1714 chunks); 3484704608 used It seems that all the free memory was consumed either by "SELECT" query which preceded trends flush or by the "UPDATE trends" batch. Total amount of memory on that machine is 30G. Hope this information helps. Thank you. | |||||||||||||||||||||||||||
| Comment by Alex Kalimulin [ 2019 Nov 26 ] | |||||||||||||||||||||||||||
|
okorolov, thanks for the detailed analysis! | |||||||||||||||||||||||||||
| Comment by ali engin [ 2019 Dec 12 ] | |||||||||||||||||||||||||||
|
Hello, When we attempt upgrade from 4.2 to 4.4, we experienced same issue.So we roll back to previous version (4.2).We are waiting official solution to this issue.İs there any plan for a fix? | |||||||||||||||||||||||||||
| Comment by Marco Scholl [ 2019 Dec 19 ] | |||||||||||||||||||||||||||
|
I have create an issue for timescale on github: https://github.com/timescale/timescaledb/issues/1569 | |||||||||||||||||||||||||||
| Comment by Konstantin Kornienko [ 2020 Jan 31 ] | |||||||||||||||||||||||||||
|
Same situation with Zabbix 4.4 and clean PostgreSQL 11 (AWS RDS), without Timescaledb.
| |||||||||||||||||||||||||||
| Comment by Erhan ERTUL [ 2020 Jan 31 ] | |||||||||||||||||||||||||||
|
Hello, we had transformed TREND tables into traditional tables instead of hypertables and the issue is gone for now. We are waiting for the exact solution to move them into hypertables again. Z4.4 P11.6 | |||||||||||||||||||||||||||
| Comment by Alex Kalimulin [ 2020 Jan 31 ] | |||||||||||||||||||||||||||
|
This might be related: https://www.postgresql-archive.org/memory-problems-and-crash-of-db-when-deleting-data-from-table-with-thousands-of-partitions-td6108612.html | |||||||||||||||||||||||||||
| Comment by Konstantin Kornienko [ 2020 Jan 31 ] | |||||||||||||||||||||||||||
|
Found that the size of concatenated 'update' query is regulated by this constant:
#define ZBX_MAX_SQL_SIZE 262144 /* 256KB */
in https://github.com/zabbix/zabbix/blob/master/include/zbxdb.h | |||||||||||||||||||||||||||
| Comment by Piotr Goczal [ 2020 Feb 27 ] | |||||||||||||||||||||||||||
|
Solution with vm.overcommit_memory=2 and vm.nr_hugepages suggested in comment fixed (at least for now) my problem with trends update eating all postgres server memory. | |||||||||||||||||||||||||||
| Comment by Konstantin Kornienko [ 2020 Feb 27 ] | |||||||||||||||||||||||||||
|
Thanks for sharing info! But it isn't suitable for cloud DBs We use AWS RDS Postgres and have huge_pages=on, but it doesn't help, partitioned DB is crashing. Controlling vm.overcommit_memory isn't supported in AWS RDS. | |||||||||||||||||||||||||||
| Comment by Oleksii Korolov [ 2020 Feb 27 ] | |||||||||||||||||||||||||||
|
To our experience vm.overcommit=2 will help your postgresql stay alive but according to your luck it will either handle the load eventually or will simply stuck in loops trying to update trends. As well in our situation it doesn't help on small instances where RAM =<4GB. Konstantin, that's why we moved from RDS to a self managed EC2 instances with PSQL.
| |||||||||||||||||||||||||||
| Comment by Evgenii grekov [ 2020 Mar 04 ] | |||||||||||||||||||||||||||
|
Hi! There is a similar problem, the timescaledb is version 11, zabbix 4.4 after restarting the zabbix server, the base starts to eat RAM as if it were not until it eats the whole swap. If you limit the memory in the docker container, then there will be a hard overhead of interrupts on the processor; by the end, everything will crash anyway. Erhan ERTUL, нou wrote that converting trends from a hypertable to a traditional one solved the memory problem, but don’t tell me how to return the table back to the traditional one. | |||||||||||||||||||||||||||
| Comment by Erhan ERTUL [ 2020 Mar 04 ] | |||||||||||||||||||||||||||
|
Hello | |||||||||||||||||||||||||||
| Comment by Erhan ERTUL [ 2020 Mar 05 ] | |||||||||||||||||||||||||||
|
Hello again, Here are the exact steps that you can go back to traditional tables instead of hypertables for trends. #Disable Zabbix first. #Create traditional trend tables as the old definitions with different names. #If you want to trim some older data before migration to save time, you can drop chunks before a specific date. This is optional. #Then you can migrate old data into new one if needed. This is optional. #Be sure that, new tables has the right data. Check the counts. --select count(itemid) from trends #Now you can drop old timescaled tables. #Lastly, rename new traditional tables as needed. #Let zabbix know that, the trend tables are not timescaled any more. #Now you can start your Zabbix. Best regards. | |||||||||||||||||||||||||||
| Comment by Evgenii grekov [ 2020 Mar 05 ] | |||||||||||||||||||||||||||
|
Erhan ERTUL, Oh thank you very much this is what you need, you really helped me out, I will also try to switch to classic tables. I’ll write about the results. | |||||||||||||||||||||||||||
| Comment by Evgenii grekov [ 2020 Mar 05 ] | |||||||||||||||||||||||||||
|
Erhan ERTUL, After translating the trends into classic tables, the problem with memory consumption disappeared, well, at least so far no problems have been noticed. We are waiting for an update to go back to hypertables. And do not tell me, but clean the history of trends through the housekeeper or by a request from the database. Today I will not try, the working day ends, and tomorrow I will try to turn on the housekeeper and see the load on the base and memory. | |||||||||||||||||||||||||||
| Comment by Alex Kalimulin [ 2020 Mar 05 ] | |||||||||||||||||||||||||||
|
borin, how many chunks did you have in your trends tables? | |||||||||||||||||||||||||||
| Comment by Evgenii grekov [ 2020 Mar 05 ] | |||||||||||||||||||||||||||
|
Kalimulin, in trends there were about 370 chunks, if by size, then trends occupied about 900M with index, and trends_uint 7GB with index. | |||||||||||||||||||||||||||
| Comment by Alex Kalimulin [ 2020 Mar 05 ] | |||||||||||||||||||||||||||
|
borin, thanks. 370 chunks * 4.3 MB means that in your case some update operations may require as much as 1.6GB of RAM to execute, if I get right what said here. | |||||||||||||||||||||||||||
| Comment by Evgenii grekov [ 2020 Mar 05 ] | |||||||||||||||||||||||||||
|
Kalimulin, I agree, but while the trends were in the hypertable, the timescaledb could gobble up 6BG of allocated RAM and 4GB swap and fell from lack of memory. | |||||||||||||||||||||||||||
| Comment by Evgenii grekov [ 2020 Mar 05 ] | |||||||||||||||||||||||||||
|
After I switched back to the classic tables for trends, the RAM of the RAM stopped. | |||||||||||||||||||||||||||
| Comment by Piotr Goczal [ 2020 Mar 11 ] | |||||||||||||||||||||||||||
Solution with vm.overcommit_memory=2 and vm.nr_hugepages suggested in comment fixed (at least for now) my problem with trends update eating all postgres server memory. Unfortunately it's not longer true. After upgrade od zabbix 4.4.6 (probably not an issue) and restart my problem is back. I've returned with trends and trends_uint back to normal table. I hope it will help. | |||||||||||||||||||||||||||
| Comment by Rainer Stumbaum [ 2020 Mar 23 ] | |||||||||||||||||||||||||||
|
I migrated last week our Database from MySQL to PostGres with TimeScaleDB because it said in the documentation it is supported (https://www.zabbix.com/documentation/current/manual/appendix/install/timescaledb ). After struggeling with missing data now the second time I am changing trends and trends_uint back.
alter table trends rename to trends_old;
CREATE TABLE trends (
        itemid                   bigint                                    NOT NULL,
        clock                    integer         DEFAULT '0'               NOT NULL,
        num                      integer         DEFAULT '0'               NOT NULL,
        value_min                numeric(16,4)   DEFAULT '0.0000'          NOT NULL,
        value_avg                numeric(16,4)   DEFAULT '0.0000'          NOT NULL,
        value_max                numeric(16,4)   DEFAULT '0.0000'          NOT NULL,
        PRIMARY KEY (itemid,clock)
);
alter table trends_uint rename to trends_uint_old;
CREATE TABLE trends_uint (
        itemid                   bigint                                    NOT NULL,
        clock                    integer         DEFAULT '0'               NOT NULL,
        num                      integer         DEFAULT '0'               NOT NULL,
        value_min                numeric(20)     DEFAULT '0'               NOT NULL,
        value_avg                numeric(20)     DEFAULT '0'               NOT NULL,
        value_max                numeric(20)     DEFAULT '0'               NOT NULL,
        PRIMARY KEY (itemid,clock)
);
INSERT INTO trends(itemid, clock, num, value_min, value_avg, value_max)
SELECT * FROM trends_old
ON CONFLICT DO NOTHING;
INSERT INTO trends_uint(itemid, clock, num, value_min, value_avg, value_max)
SELECT * FROM trends_uint_old
ON CONFLICT DO NOTHING;
This might take some time here:
Why does the documentation still say it is supported with such a bug exisiting and no seemingly no sun at the end of the tunnel?!?!? Please adjust the documentation and warn about the missing stability! | |||||||||||||||||||||||||||
| Comment by Markus Fischbacher [ 2020 Apr 01 ] | |||||||||||||||||||||||||||
|
We have the same problem here. @eertul would changing only the history tables back to plain postgres interfere with housekeeper? | |||||||||||||||||||||||||||
| Comment by Rainer Stumbaum [ 2020 Apr 01 ] | |||||||||||||||||||||||||||
|
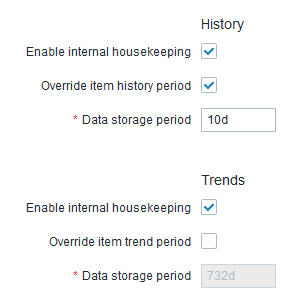
I did not experience problems with the history* tables, only with trends* tables. So my history* tables are still timescaledb-hypertables and only trends* tables are standard postgres tables now. I start the housekeeper by using cron at fixed times so I set HousekeepingFrequency to 0. The Administration -> General -> Housekeeping settings look like this now:
So the history* tables are cleaned by using drop_chunk and the trends* tables are cleaned by SQL Delete statements on a per item basis.
| |||||||||||||||||||||||||||
| Comment by Markus Fischbacher [ 2020 Apr 01 ] | |||||||||||||||||||||||||||
|
Sorry ... we too have troubles with the trends tables not the history tables! But I converted the correct one Edit: will try something | |||||||||||||||||||||||||||
| Comment by Rainer Stumbaum [ 2020 Apr 01 ] | |||||||||||||||||||||||||||
|
As always: It is a bad idea to mix additional functionality (here to use drop_chunk) with an existing switch (here "Override item history period")... | |||||||||||||||||||||||||||
| Comment by Markus Fischbacher [ 2020 Apr 09 ] | |||||||||||||||||||||||||||
|
As this seams to be related to Timescale or more specific to postgres partitioning wouldn't be a warning in the docs a good idea? Also, see the timescale issue thread for some comments on longer term chunk partitioning instead of daily. Maybe weekly at least for trends and even as standard by Zabbix ootb? This might drastically lower chunks over time. And the whole problems seam to impact only trends. | |||||||||||||||||||||||||||
| Comment by Alex Kalimulin [ 2020 Apr 09 ] | |||||||||||||||||||||||||||
Thanks for suggestion. Given that there is not much we can do about Postgres internals and the problem is still present in 12 documenting it and changing trends defaults sounds like a good idea. | |||||||||||||||||||||||||||
| Comment by George Machitidze [ 2020 Apr 10 ] | |||||||||||||||||||||||||||
|
Is there anybody NOT running Centos 7? All the reports I see are related to Centos 7 packages... Please confirm | |||||||||||||||||||||||||||
| Comment by Piotr Goczal [ 2020 Apr 10 ] | |||||||||||||||||||||||||||
|
The same problem on Ubuntu 18.10 | |||||||||||||||||||||||||||
| Comment by Rainer Stumbaum [ 2020 Apr 10 ] | |||||||||||||||||||||||||||
|
George Machitidze, using TimeScaleDB with a Proxy is not supported. I always suggest to run software in the projects own docker container. I am running TimeScaleDB and Zabbix in their containers on a Debian 10 system. So I do not have the discussion that my problem is caused by my choice of the underlying operating system. | |||||||||||||||||||||||||||
| Comment by Markus Fischbacher [ 2020 Apr 14 ] | |||||||||||||||||||||||||||
|
@giomac @georgemachitidze (does anybode know how to correctly link people in Jira) ... TimescaleDB isn't supported on Proxy as Rainer Stumbaum already mentioned - it's documented in official docs too. Also I feel like it would be way to much overhead too. Proxies didn't store this much and long datasets. If you feel the need for TimescaleDB on your Proxy you maybe should split them up more or have a look in other performance related tunings. Timescale really does shine only for big datasets over longer timespans. There is negligible performance to zero performance gains for other datasets. @Kalimulin ... great to hear that this issue is now "accepted". May you please link to the git commit so we might have an early look into it? | |||||||||||||||||||||||||||
| Comment by George Machitidze [ 2020 Apr 14 ] | |||||||||||||||||||||||||||
|
No worries, I didn't say it's running on proxy | |||||||||||||||||||||||||||
| Comment by Markus Fischbacher [ 2020 Apr 14 ] | |||||||||||||||||||||||||||
|
Sorry so I have misunderstood that. Yeah it's definitely not a problem of specific packages. Having Ubuntu tested and RHEL in prod - booth with problems. If you read the comments above I think the Team is accepting this issue as existing and they might highlight it in docs and also may change the timespan for the timescale chunks. That would lead to less table partitions which seam to be the problem for postgres. I also updated the issue over at timescale and requested status there. Postgres had some big changes on partitions with version 10 (or was it 11?) and now with 12 there where some optimizations again. So I think we might see fixes there. That said I couldn't find an official issue for postgres itself. So if someone has already found something please state it here. If not I think about creating an issue there too and linking the other 2 ones to it. Maybe other people with other solutions have troubles too. | |||||||||||||||||||||||||||
| Comment by Konstantin Kornienko [ 2020 Apr 17 ] | |||||||||||||||||||||||||||
|
Zabix team, please keep in mind, that "plain" partitioned Postgres (without timescaledb) is also affected. Thanks that you decided to fix this! | |||||||||||||||||||||||||||
| Comment by Markus Fischbacher [ 2020 Apr 17 ] | |||||||||||||||||||||||||||
|
Hmm... @konstantin.kornienko I doubt if they can FIX it | |||||||||||||||||||||||||||
| Comment by Konstantin Kornienko [ 2020 Apr 17 ] | |||||||||||||||||||||||||||
|
Markus, It can be fixed, I've posted details earlier (Jan 31, 14:14). The problem is that zabbix performs very large sql updates, like: update trends set value=x where itemid=y; It kills postgres. So the solution is simple, I think, these big updates should be splitted in smaller chunks. For now it's 256 KiB. >>>BTW: is native partitioned postgres supported? Don't think it's supported by Zabbix team, but we're implemented it and it's works fine! I can share the solution if you want. | |||||||||||||||||||||||||||
| Comment by Rainer Stumbaum [ 2020 Apr 17 ] | |||||||||||||||||||||||||||
|
IMHO the solution could be to just expose ZBX_MAX_SQL_SIZE as a Parameter. Most people won't know about it and leave it to the default. People using partitioning could adjust it to something smaller. | |||||||||||||||||||||||||||
| Comment by Konstantin Kornienko [ 2020 Apr 17 ] | |||||||||||||||||||||||||||
|
Rainer, completely agreed. | |||||||||||||||||||||||||||
| Comment by Aaron Whiteman [ 2020 Apr 30 ] | |||||||||||||||||||||||||||
|
Now that the status is changed to RESOLVED, where can I find the timeline on a 4.4.9 release? | |||||||||||||||||||||||||||
| Comment by Rainer Stumbaum [ 2020 Apr 30 ] | |||||||||||||||||||||||||||
|
There seems no commit related to this issue. How did it get fixed? | |||||||||||||||||||||||||||
| Comment by Artjoms Rimdjonoks [ 2020 May 12 ] | |||||||||||||||||||||||||||
|
Migration note It is the PostgreSQL issue which not optimised to update tables with many partitions. The natural solution to this issue is to limit the number of partitions on the system for trends and trends_uint tables. Newer versions of Zabbix will do that by setting a significantly larger (1 month) time interval chunk in the updated database setup script (timescaledb.sql). However, the users that already had the TimescaleDB configured to use the old (1 day (or 86400 seconds)) interval might want to upgrade the trends and trends_uint tables. The quick solution would be to run the following: SELECT set_chunk_time_interval('trends', 2628000);
SELECT set_chunk_time_interval('trends_uint', 2628000);
Unfortunately, this does not affect the existing chunks which will stay in the system until they get deleted by the housekeeper (after 1 year by default). Proper upgrade might take some time for the large databases, it involves converting existing historical 1-day chunks into the 1-month chunks: CREATE TABLE trends (
itemid bigint NOT NULL,
clock integer DEFAULT '0' NOT NULL,
num integer DEFAULT '0' NOT NULL,
value_min DOUBLE PRECISION DEFAULT '0.0000' NOT NULL,
value_avg DOUBLE PRECISION DEFAULT '0.0000' NOT NULL,
value_max DOUBLE PRECISION DEFAULT '0.0000' NOT NULL,
PRIMARY KEY (itemid,clock)
);
3) make it a hypertable with updated 1 month interval: SELECT create_hypertable('trends', 'clock', chunk_time_interval => 2628000, migrate_data => true);
4) move the data: INSERT INTO trends(itemid, clock, num, value_min, value_avg, value_max) SELECT * FROM trends_old ON CONFLICT DO NOTHING; 5) Check that new trends table has the data and it looks reasonable: select count(*) from trends; 6) Check the resulting number of chunks on the system: SELECT * FROM chunk_relation_size_pretty('trends');
It should be around from 1 to 12. (it could be more if your have been running the timescale for longer than a year and not running the housekeeper for longer than a year) 7) If everything is fine - delete the temporary tables: drop table trends_old; 8) repeat all of those steps for the trends_uint table That should be enough to deal with most use-cases. However, if issue still persists (which might happen for the very large updates on the systems with low-amount of RAM) - the best option would be to stop using TimescaleDB (or partitioned PostgreSQL) for trends and trends_uint tables: SELECT * FROM chunk_relation_size_pretty('trends');
does not returns the chunks info anymore. | |||||||||||||||||||||||||||
| Comment by Artjoms Rimdjonoks [ 2020 May 12 ] | |||||||||||||||||||||||||||
|
Investigation 1 (why the monthly interval for trends and trends_uints is an optimal configuration) Testing environment PostgreSQL 12.2 TimescaleDB version 1.7.0 RAM - 8192 Mb Ubuntu 18.04 (Zabbix database is re-recreated from scratch for every test) 1) TimescaleDB test, update on 700 TRENDS table rows 1.1) Set the interval of 3 seconds for trends in database/postgresql/timescaledb.sql 1.2) SELECT * FROM chunk_relation_size_pretty('trends');
Result - 233 partitions created 1.3)
import psycopg2
from psycopg2 import Error

try:
    connection = psycopg2.connect(user = "zabbix",
                                  password = "useruser",
                                  host = "localhost",
                                  database = "zabbix")

    cursor = connection.cursor()

    c = 1587549139
    create_table_query = ""
    for x in range(700):

        create_table_query += " UPDATE trends set value_min=0.23,value_avg=0.24,value_max=0.25 where itemid=10062 and clock='%s';" % c
        c = c+1

    print "executing: " + create_table_query
    cursor.execute(create_table_query)
    connection.commit()
    print "ALL READY"

except (Exception, psycopg2.DatabaseError) as error :
    print ("Error while creating PostgreSQL table", error)
finally:
        if(connection):
            cursor.close()
            connection.close()
            print("PostgreSQL connection is closed")
Result - 100% memory usage, database crash with the following error: WARNING: terminating connection because of crash of another server process DETAIL: The postmaster has commanded this server process to roll back the current transaction and exit, because another server process exited abnormally and possibly corrupted shared memory. Update is reverted 2.1) Set the interval of 4 seconds for trends in database/postgresql/timescaledb.sql 2) PostgreSQL without TimescaleDB - update on 700 TRENDS table rows create_trends_query = "CREATE TABLE trends ("\
"itemid bigint NOT NULL,"\
"clock integer DEFAULT '0' NOT NULL,"\
"num integer DEFAULT '0' NOT NULL,"\
"value_min DOUBLE PRECISION DEFAULT '0.0000' NOT NULL,"\
"value_avg DOUBLE PRECISION DEFAULT '0.0000' NOT NULL,"\
"value_max DOUBLE PRECISION DEFAULT '0.0000' NOT NULL,"\
"PRIMARY KEY (itemid,clock)"\
") PARTITION BY RANGE (clock);
Use the script to manually create partitions like: for x in range(233):
create_table_query += " create table trends_%s partition of trends for values from (%d) to (%d);" % (c,c,c+3)
c = c+3
Result: outcome is the same as for TimescaleDB, update on 175 partitions proceeds, on 233 partitions it fails Conclusions 3) Test with the large update - 10000 items (10 times bigger than the value of 1000 items that is normally observed by the support) Use weekly interval - (52 partitions) - same crash on both TimescaleDB and PostgreSQL Conclusion - the monthly interval is an optimal solution for the most systems. Also, this value is currently suggested in the mysql partitioning on https://zabbix.org/wiki/Docs/howto/mysql_partitioning) This might be reviewed if there is any progress made on https://www.postgresql-archive.org/memory-problems-and-crash-of-db-when-deleting-data-from-table-with-thousands-of-partitions-td6108612.html. | |||||||||||||||||||||||||||
| Comment by Markus Fischbacher [ 2020 May 12 ] | |||||||||||||||||||||||||||
|
How’s the community saying about update to 5.0 with the trend tables manually changed to native tables? i would say we have to be careful with the applied .sql scripts but the package doesn’t touch the tables so it’s good? another way I think of is transforming the tables again to hypertables but with the above settings? | |||||||||||||||||||||||||||
| Comment by Aaron Whiteman [ 2020 May 12 ] | |||||||||||||||||||||||||||
|
I noticed in your testing, you are still creating a single concatenated UPDATE query, rather than running multiple updates. What happens when you run the same 700 updates in smaller batches (say 50 at a time). What is the overall time it takes to run the 700 updates at once vs a smaller batch running in a loop. What is the performance when you don't concatenate updates at all and just execute each update sequentially (preferably using prepare/execute methods)
import psycopg2 from psycopg2 import Error try: connection = psycopg2.connect(user = "zabbix", password = "useruser", host = "localhost", database = "zabbix") cursor = connection.cursor() c = 1587549139 print "setting up prepared query for single update" cursor.execute("prepare myplan as UPDATE trends set value_min=0.23,value_avg=0.24,value_max=0.25 where itemid=10062 and clock=$1") for x in range(700) print "executing with variable: " + c cur.execute("execute myplan(%s)",c c = c+1 connection.commit() print "ALL READY" except (Exception, psycopg2.DatabaseError) as error : print ("Error while creating PostgreSQL table", error) finally: if(connection): cursor.close() connection.close() print("PostgreSQL connection is closed") <arimdjonoks> putting queries in batches could help but as I understand this would not reflect how zabbix_proxy currently sends updates to the server and changing this mechanism would be too big architectural change for the system to consider it. | |||||||||||||||||||||||||||
| Comment by Aaron Whiteman [ 2020 May 12 ] | |||||||||||||||||||||||||||
|
Reducing the number of partitions may help, at the expense of significant variation in disk usage. Our trend table is ~27Gb, and our trend_uint table ~921Gb, and covers 400 days (about 13 months). At roughly 2.4Gb/day, changing the number of partitions from 400 to 13 would increase our disk usage by up to 71Gb (admittedly a small percentage, but not a small number).
We're already very concerned about disk capacity and schema changes in general due to the amount of time and disk space it takes when a ALTER TABLE hits us. If this change is rolled out as described (reducing partitions), how do I test that my database will have the space/performance to make the transition? Will it be locked the entire time? <arimdjonoks> There is no ALTER TABLE involved - a new copy of the trends table is created and then after the transition - the original is deleted. If a new copy of the trends table fails to get populated due to the lack of space - nothing is changed for the original trends table. If there is not enough enough space to copy the trends tables you can update the chunk interval: SELECT set_chunk_time_interval('trends', 2628000);
SELECT set_chunk_time_interval('trends_uint', 2628000);
and gradually within a year all the original daily chunks would be automatically removed by a housekeeper, so there would be no migration required. | |||||||||||||||||||||||||||
| Comment by Artjoms Rimdjonoks [ 2020 May 13 ] | |||||||||||||||||||||||||||
|
Investigation 2 (why we cannot just reduce the size of the update) Using the scripts from the Investigation 1: TimescaleDB, 7500 time_chunks, 1 row update for x in range(1):
create_table_query += " UPDATE trends set value_min=0.23,value_avg=0.24,value_max=0.25 where itemid=10062 and clock='%s';" % c
c = c+1
1.3) Result - the same database crash as in the Investigation 1 2.1) TimescaleDB, 6000 time_chunks, 1 update 3.1) PostgreSQL with manual partitions Conclusion: Limiting amount of partitions for the tables that gets regularly updated looks to be a much safer option. | |||||||||||||||||||||||||||
| Comment by Artjoms Rimdjonoks [ 2020 May 15 ] | |||||||||||||||||||||||||||
|
Available in versions:
Please note that this fix is for the new installations of TimescaleDB. Updated documentation: | |||||||||||||||||||||||||||
| Comment by Janis Ritmanis [ 2020 Jun 05 ] | |||||||||||||||||||||||||||
|
I want to add one small note to the migration procedure for existing timescale setups (changing the data intervals). The procedure worked successfully for me, but my failure was that for the procedure I connected to the DB using postgres user. As result - the new tables where created with a different owner. So my suggestion would be to check the new tables using \dt if the owner for the new tables are the correct one, and if it's not - change the owner. | |||||||||||||||||||||||||||
| Comment by Ran Givon [ 2020 Jun 13 ] | |||||||||||||||||||||||||||
|
thanks for the great work around artjoms. Easily managed to merge to fewer chunks - one per month. 9) recreating the index on both trends and trends_uint tables. (for example )
CREATE INDEX trends_uint_clock_idx
 ON public.trends_uint USING btree
 (clock DESC NULLS FIRST)
 TABLESPACE pg_default;
10) run Vaccum | |||||||||||||||||||||||||||
| Comment by Tomasz Chruściel [ 2020 Jul 23 ] | |||||||||||||||||||||||||||
|
Is it ok to keep 7-days history and trends commpression period after I've changed chunk_time_interval for trends and trends_uint to 1-month chunks? Won't it try to compress "active" trend* chunks? Does it matter?
| |||||||||||||||||||||||||||
| Comment by Artjoms Rimdjonoks [ 2020 Jul 24 ] | |||||||||||||||||||||||||||
|
tomaszc It is ok to keep 7-days history and trends compression while increasing the chunk_time_interval to 1-month. Timescale does not compress active chunks. |