[ZBX-16374] Zabbix trapper processes possible hangup Created: 2019 Jul 15 Updated: 2020 Apr 08 Resolved: 2020 Apr 08 |
|
| Status: | Closed |
| Project: | ZABBIX BUGS AND ISSUES |
| Component/s: | Server (S) |
| Affects Version/s: | 4.2.3 |
| Fix Version/s: | None |
| Type: | Incident report | Priority: | Trivial |
| Reporter: | Valeriy Zabawski | Assignee: | Edgar Akhmetshin |
| Resolution: | Incomplete | Votes: | 0 |
| Labels: | server, trapper | ||
| Remaining Estimate: | Not Specified | ||
| Time Spent: | Not Specified | ||
| Original Estimate: | Not Specified | ||
| Environment: |
Zabbix Server (RHEL 7.6), AWS EC2 c4.xlarge |
||
| Attachments: |
|
| Description |
|
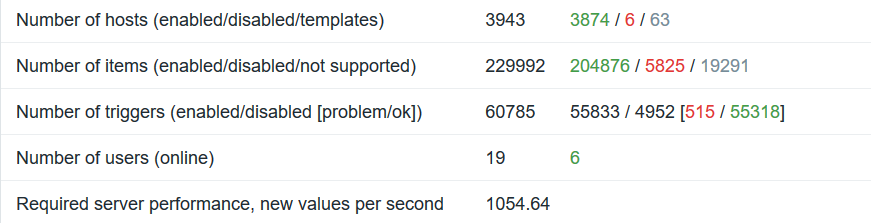
Server info: Incident details:
10957:20190714:052308.169 received configuration data from server at "*******", datalen 426293
 10958:20190714:052602.513 cannot send heartbeat message to server at "*******": ZBX_TCP_READ() timed out
 10958:20190714:052702.517 cannot send heartbeat message to server at "*******": ZBX_TCP_READ() timed out
 10958:20190714:052802.520 cannot send heartbeat message to server at "*******": ZBX_TCP_READ() timed out
 10958:20190714:052902.523 cannot send heartbeat message to server at "*******": ZBX_TCP_READ() timed out
 10958:20190714:053002.526 cannot send heartbeat message to server at "*******": ZBX_TCP_READ() timed out
 10958:20190714:053102.529 cannot send heartbeat message to server at "*******": ZBX_TCP_READ() timed out
Agents that are monitored by Zabbix server itself stay green and data is being collected. Zabbix server logs contains no suspicious records, just info about items that became unsupported. The environment stays in that condition for several hours and Zabbix server starts receiving data from Zabbix proxies only after a reboot via # systemctl restart zabbix-server Proxy log:
10959:20190715:061449.816 Unable to connect to the server [******************]:10051 [cannot connect to [[******************]:10051]: [111] Connection refused]. Will retry every 1 second(s)
 10959:20190715:061455.824 Connection restored.
 10957:20190715:061824.192 received configuration data from server at "******************", datalen 426293
 10960:20190715:062122.585 executing housekeeper
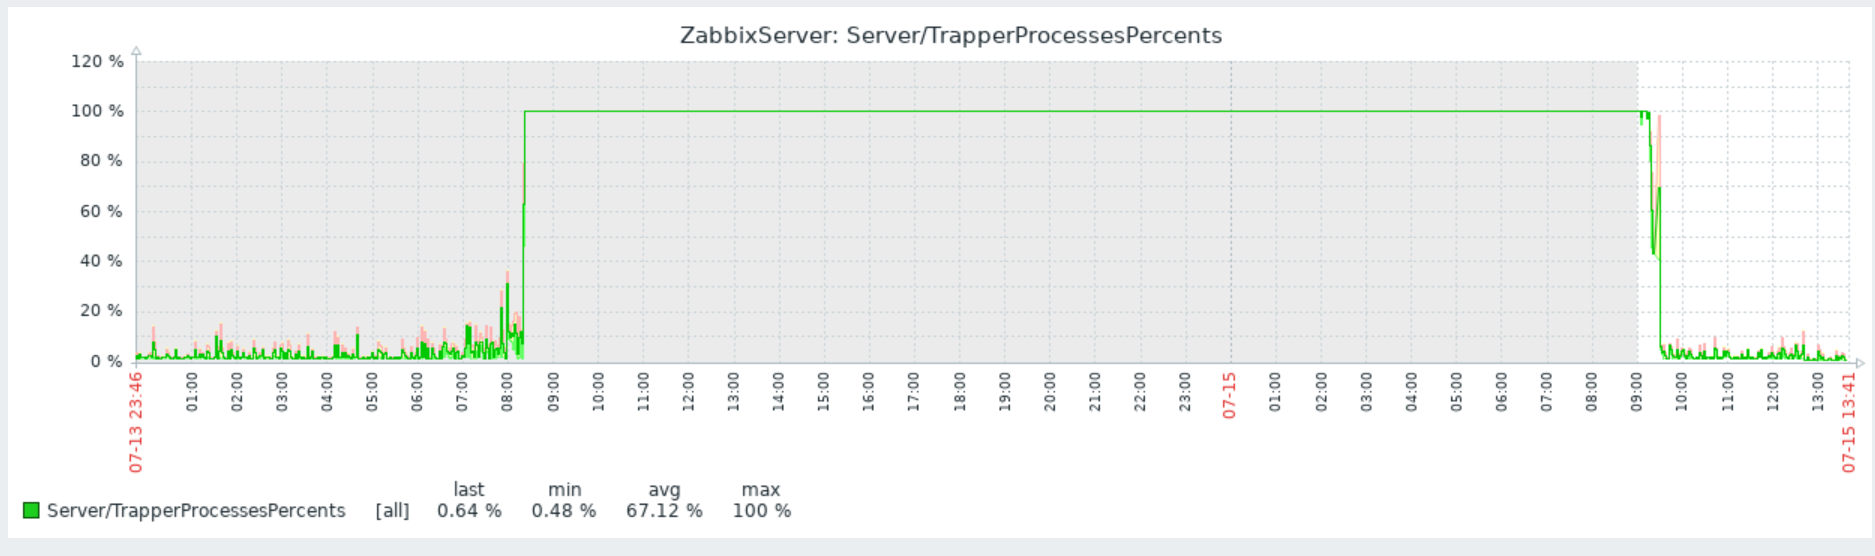
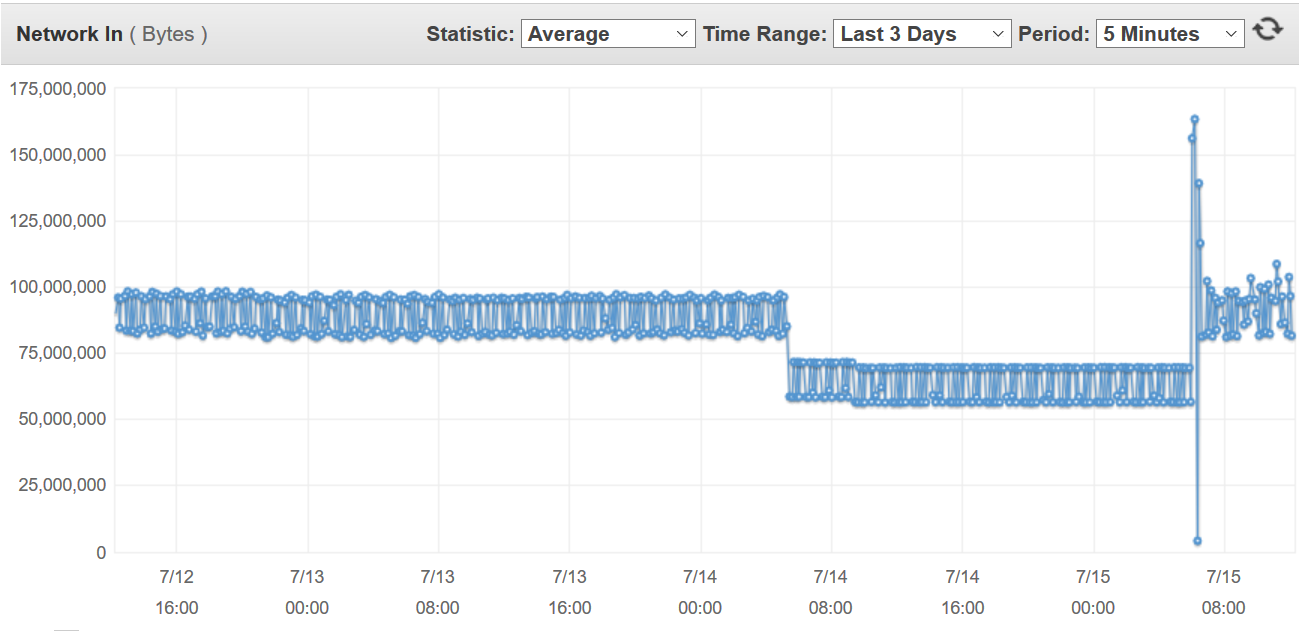
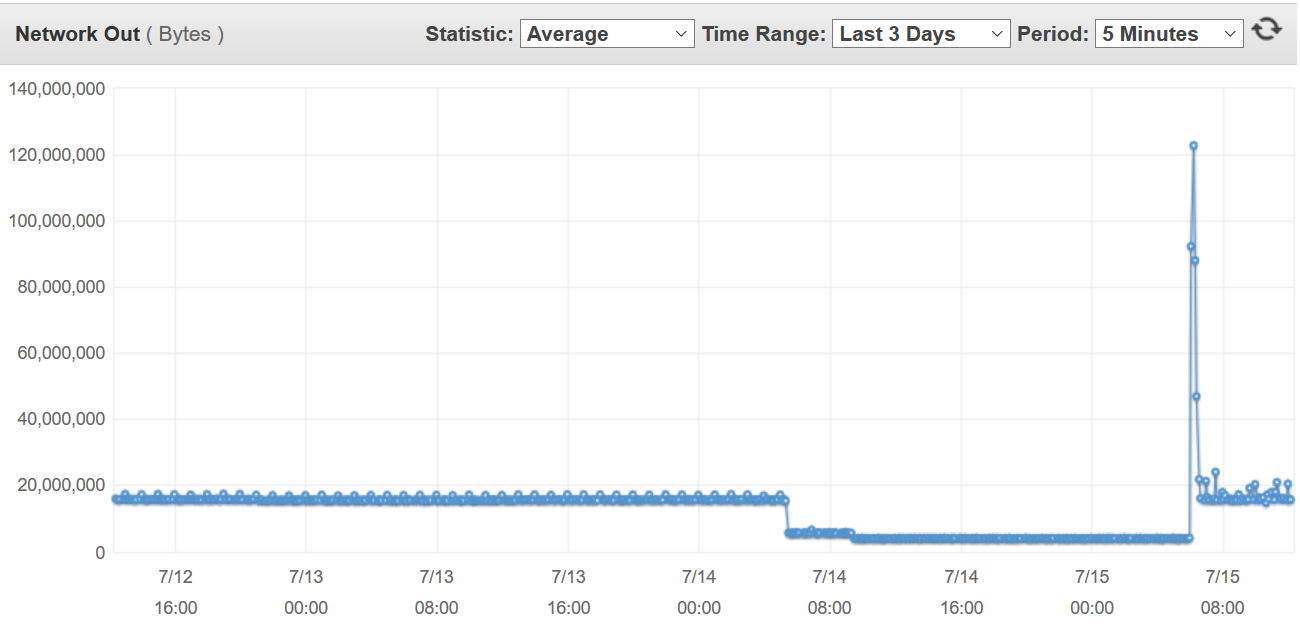
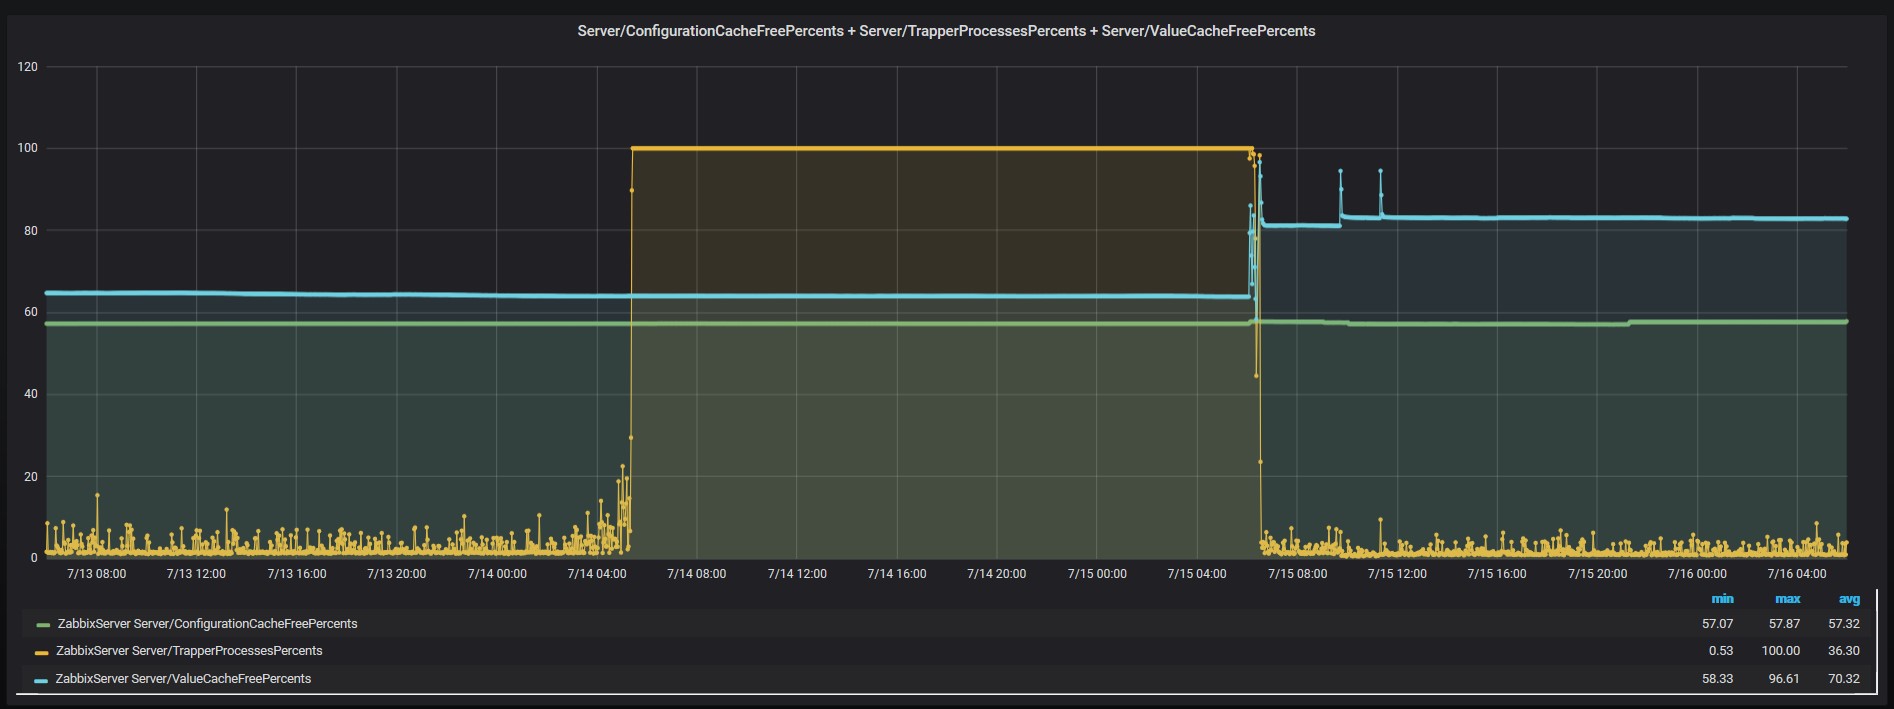
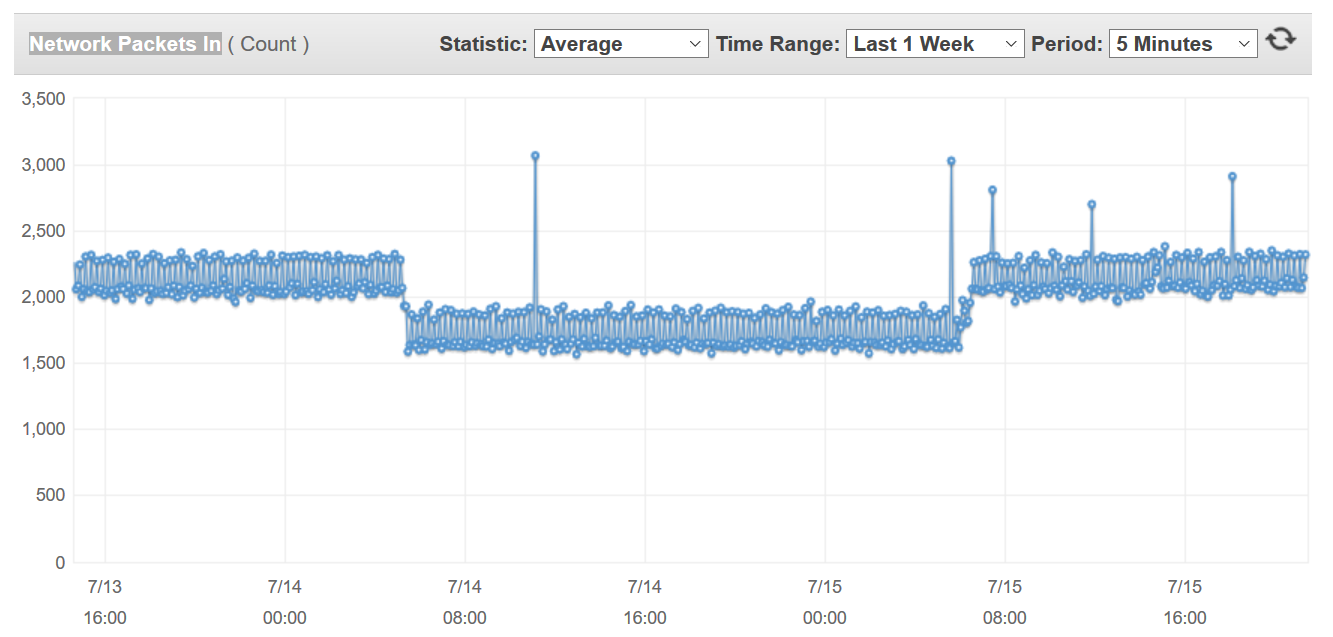
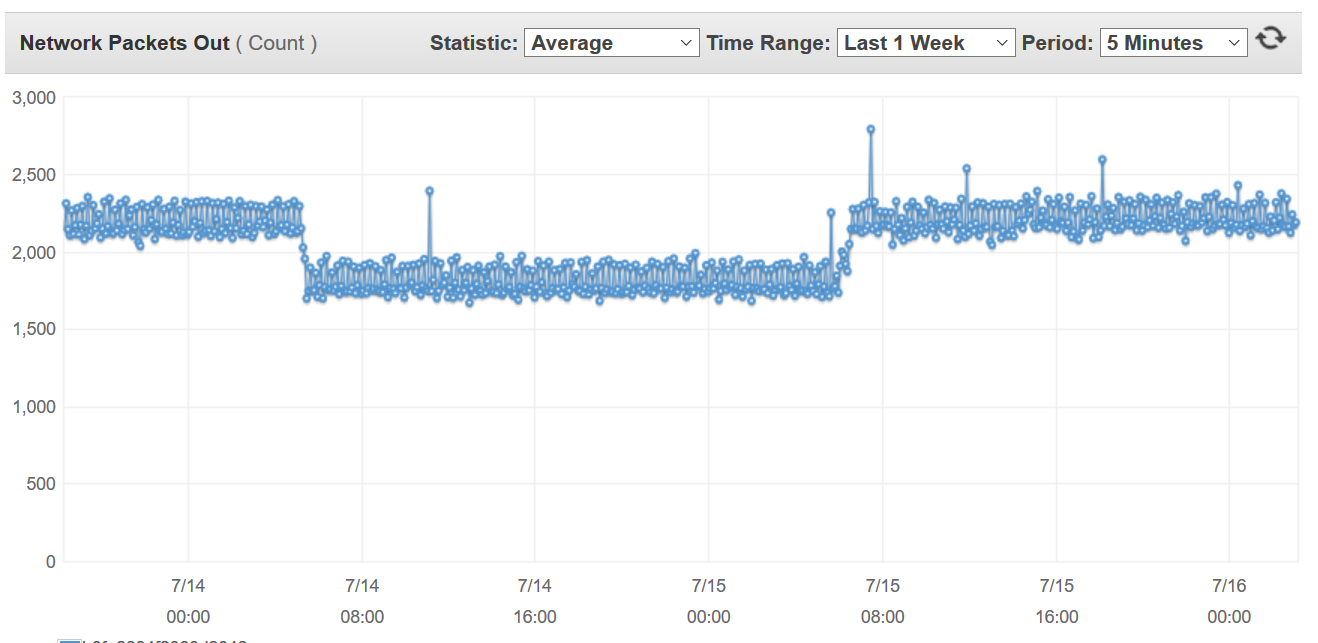
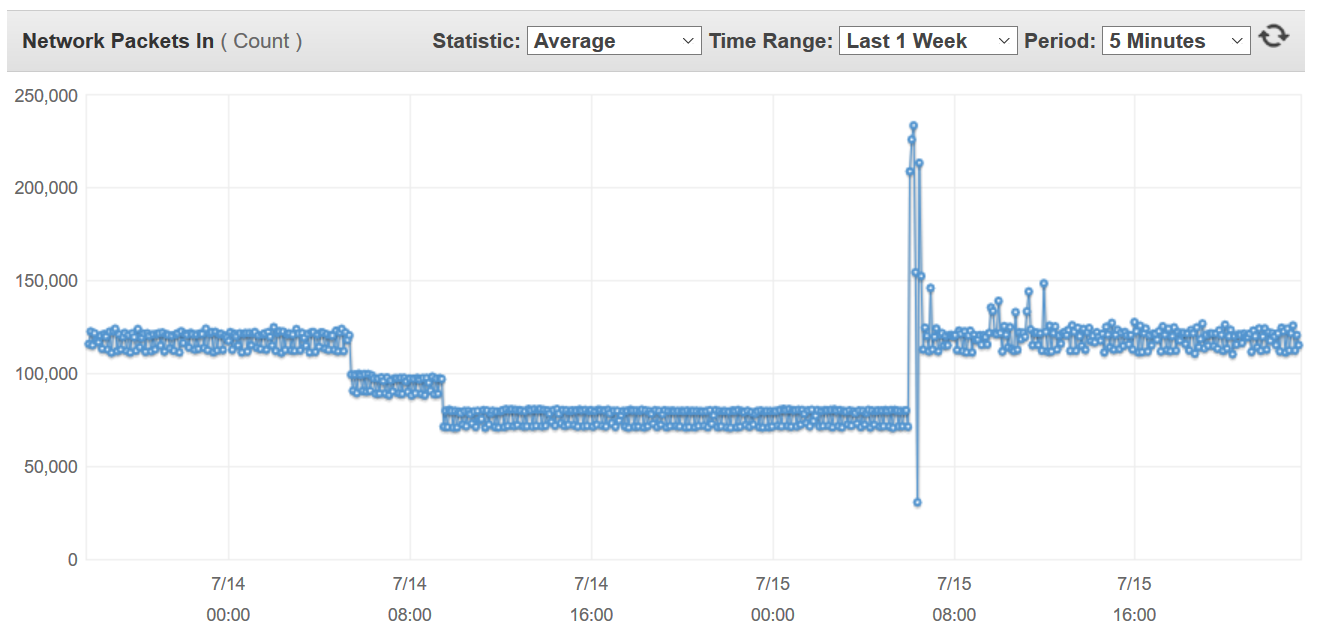
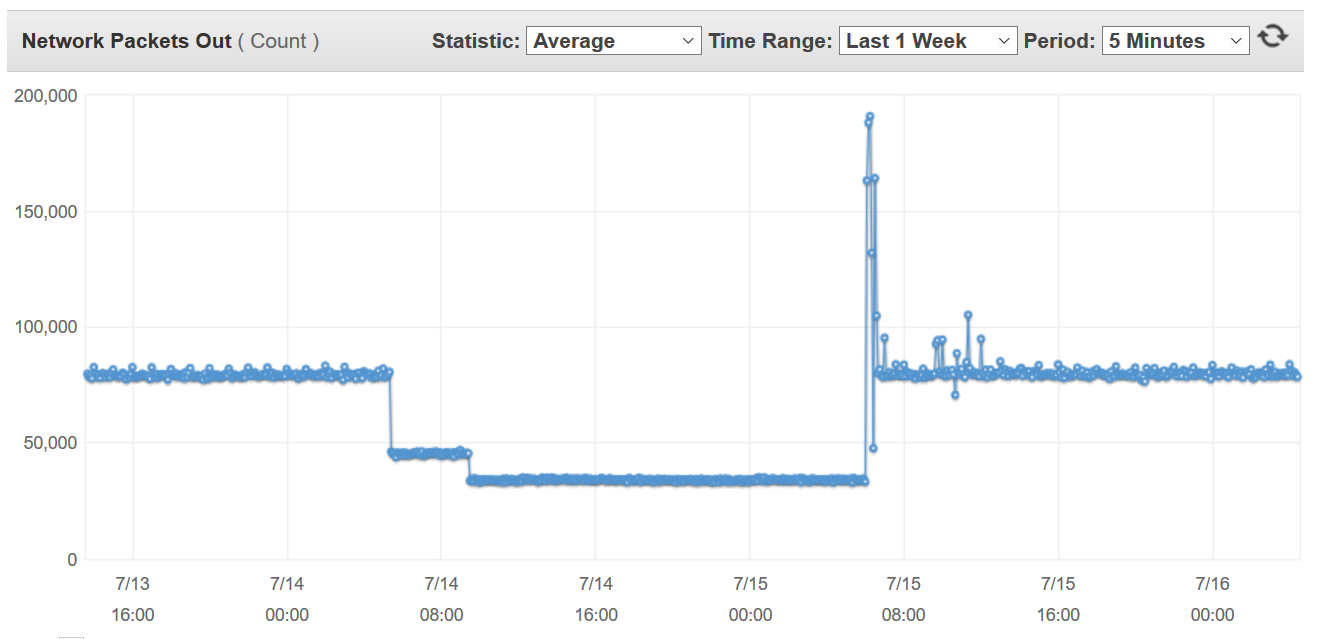
It could be related to network issues, but we couldn't find any evidences. Network traffic on Zabbix server:
It's unclear for me why Zabbix trappers suddenly increased to 100% and stuck at that value because TrapperTimeout=15 should prevent trappers from hanging. Could you please tell me what do you think about this situation? I would like to prevent such situation in the future, so maybe you'll point me at where else should I look in order to investigate this incident properly. |
| Comments |
| Comment by Edgar Akhmetshin [ 2019 Jul 18 ] |
|
Hello Valeriy, Can you please attach performance graphs from Monitoring → Graphs → select your Zabbix Server showing time period of 1 day and the same graphs for one of the proxies used:
Also required:
Do you have network performance graphs? With latency, packet loss, etc..? Regards, |
| Comment by Valeriy Zabawski [ 2019 Jul 18 ] |
|
Hello Edgar, We don't have some metrics you've requested but I can enable them now and attach them a bit later if it's okay for you. For now, here's what I have: Zabbix server config: Zabbix proxy config: We don't filter traffic. Connections to Zabbix server are limited by RHEL 7.6 firewall. Ping from Zabbix server to proxy: [ec2-user*********** ~]$ ping *********** PING *********** (*********** ) 56(84) bytes of data. 64 bytes from *********** : icmp_seq=1 ttl=64 time=0.280 ms 64 bytes from *********** : icmp_seq=2 ttl=64 time=0.259 ms 64 bytes from *********** : icmp_seq=3 ttl=64 time=0.211 ms 64 bytes from *********** : icmp_seq=4 ttl=64 time=0.231 ms 64 bytes from *********** : icmp_seq=5 ttl=64 time=0.284 ms 64 bytes from *********** : icmp_seq=6 ttl=64 time=0.228 ms 64 bytes from *********** : icmp_seq=7 ttl=64 time=0.247 ms 64 bytes from *********** : icmp_seq=8 ttl=64 time=0.248 ms ^C --- *********** ping statistics --- 8 packets transmitted, 8 received, 0% packet loss, time 7000ms rtt min/avg/max/mdev = 0.211/0.248/0.284/0.028 ms Unfortunately, we don't have any network performance graphs except ones we have in AWS.
Zabbix server:
That's the most of the information I was able to gather. Feel free to ask if you need anything else. Best regards, Valery |
| Comment by Valeriy Zabawski [ 2019 Jul 18 ] |
|
Just in case, here's the list of item keys from metrics we are currently collection on our Zabbix server: agent.ping system.run["mysql -h {$DBINSTANCE} -u{$DBUSER} -p{$DBPASS} -NBL <{$DBQUERY} | grep -w history"] system.run["mysql -h {$DBINSTANCE} -u{$DBUSER} -p{$DBPASS} -NBL <{$DBQUERY} | grep -w history_log"] system.run["mysql -h {$DBINSTANCE} -u{$DBUSER} -p{$DBPASS} -NBL <{$DBQUERY} | grep -w history_str"] system.run["mysql -h {$DBINSTANCE} -u{$DBUSER} -p{$DBPASS} -NBL <{$DBQUERY} | grep -w history_text"] system.run["mysql -h {$DBINSTANCE} -u{$DBUSER} -p{$DBPASS} -NBL <{$DBQUERY} | grep -w history_uint"] system.run["mysql -h {$DBINSTANCE} -u{$DBUSER} -p{$DBPASS} -NBL <{$DBQUERY} | grep -w trends"] system.run["mysql -h {$DBINSTANCE} -u{$DBUSER} -p{$DBPASS} -NBL <{$DBQUERY} | grep -w trends_uint"] zabbix[lld_queue] zabbix[process,alerter,avg,busy] zabbix[process,configuration syncer,avg,busy] zabbix[process,db watchdog,avg,busy] zabbix[process,discoverer,avg,busy] zabbix[process,escalator,avg,busy] zabbix[process,history syncer,avg,busy] zabbix[process,housekeeper,avg,busy] zabbix[process,http poller,avg,busy] zabbix[process,java poller,avg,busy] zabbix[process,poller,avg,busy] zabbix[process,proxy poller,avg,busy] zabbix[process,self-monitoring,avg,busy] zabbix[process,timer,avg,busy] zabbix[process,trapper,avg,busy] zabbix[process,unreachable poller,avg,busy] zabbix[queue,1m] zabbix[queue,5m] zabbix[queue,10m] zabbix[rcache,buffer,pfree] zabbix[vcache,buffer,pfree] zabbix[vcache,cache,hits] zabbix[vcache,cache,misses] zabbix[vcache,cache,mode] zabbix[wcache,history,pfree] zabbix[wcache,index,pfree] zabbix[wcache,trend,pfree] zabbix[wcache,values] |
| Comment by Edgar Akhmetshin [ 2019 Jul 19 ] |
|
Hello Valeriy, We need all requested information, also please note network performance could not be tested with small packet size (64 byte). Also please clarify the number of conntrack connections on Zabbix Server. Regards, |
| Comment by Valeriy Zabawski [ 2019 Jul 23 ] |
|
Could you please advise me a better way to test network performance which will be acceptable for you? |
| Comment by Valeriy Zabawski [ 2019 Jul 25 ] |
|
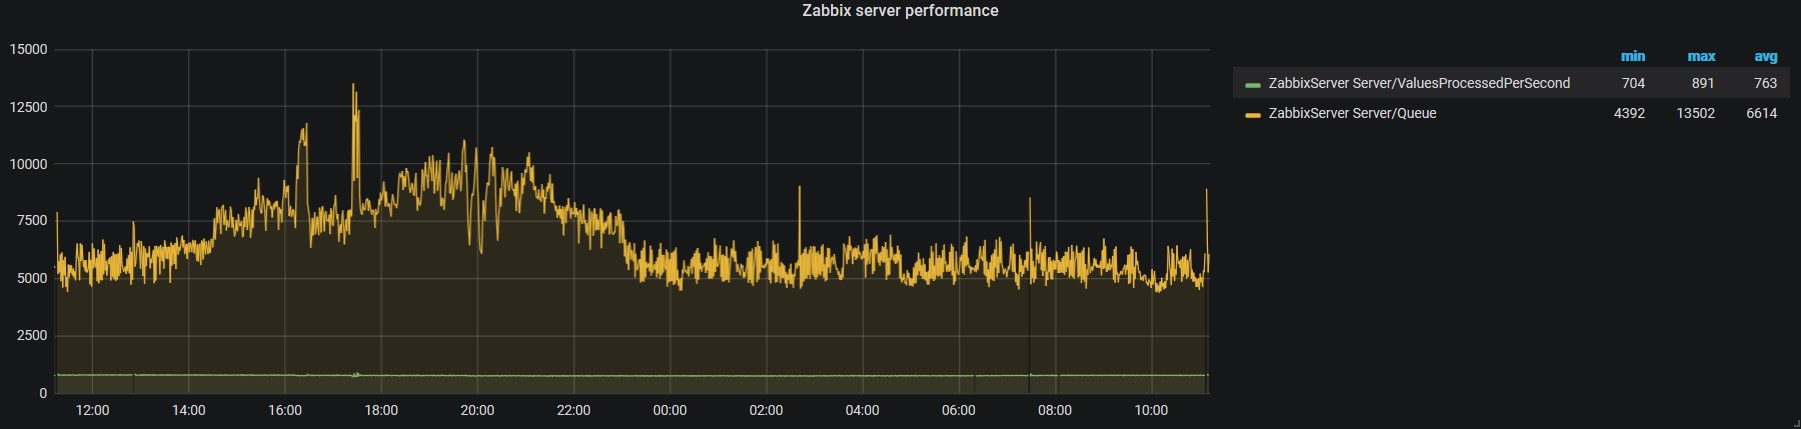
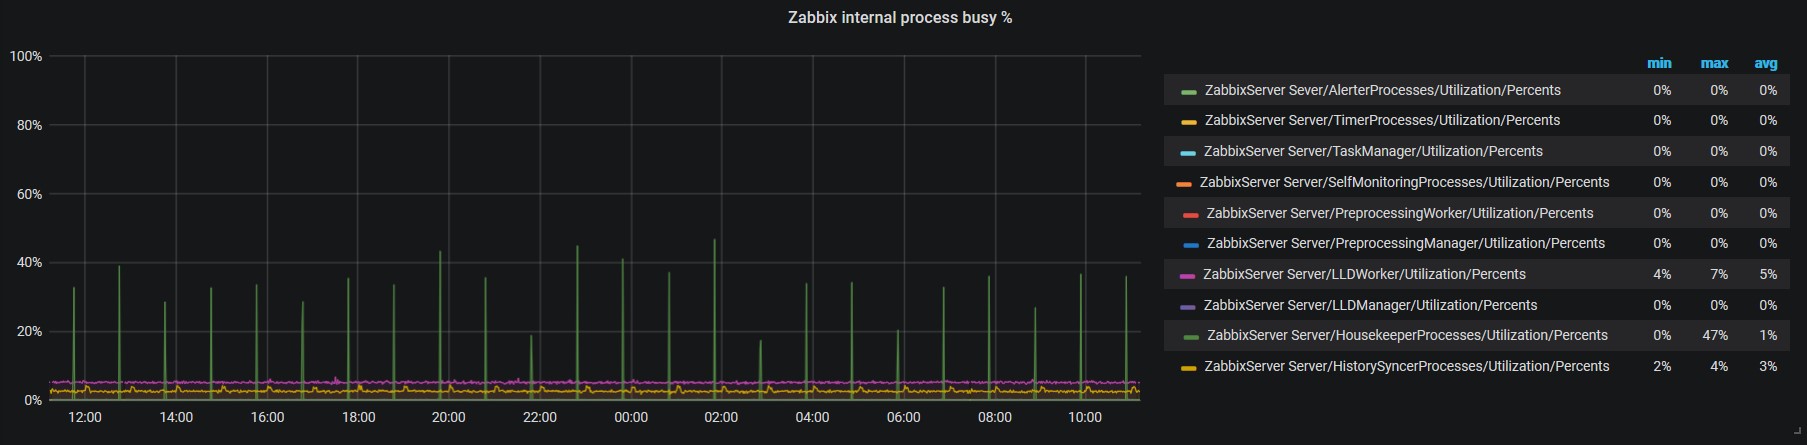
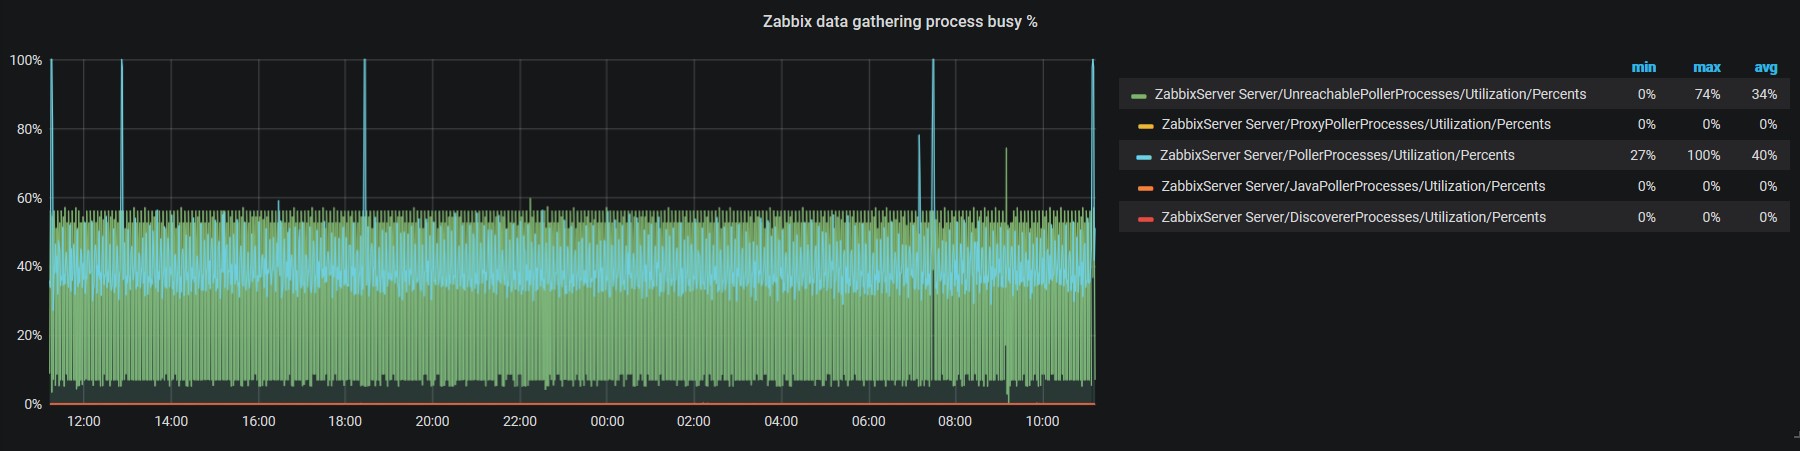
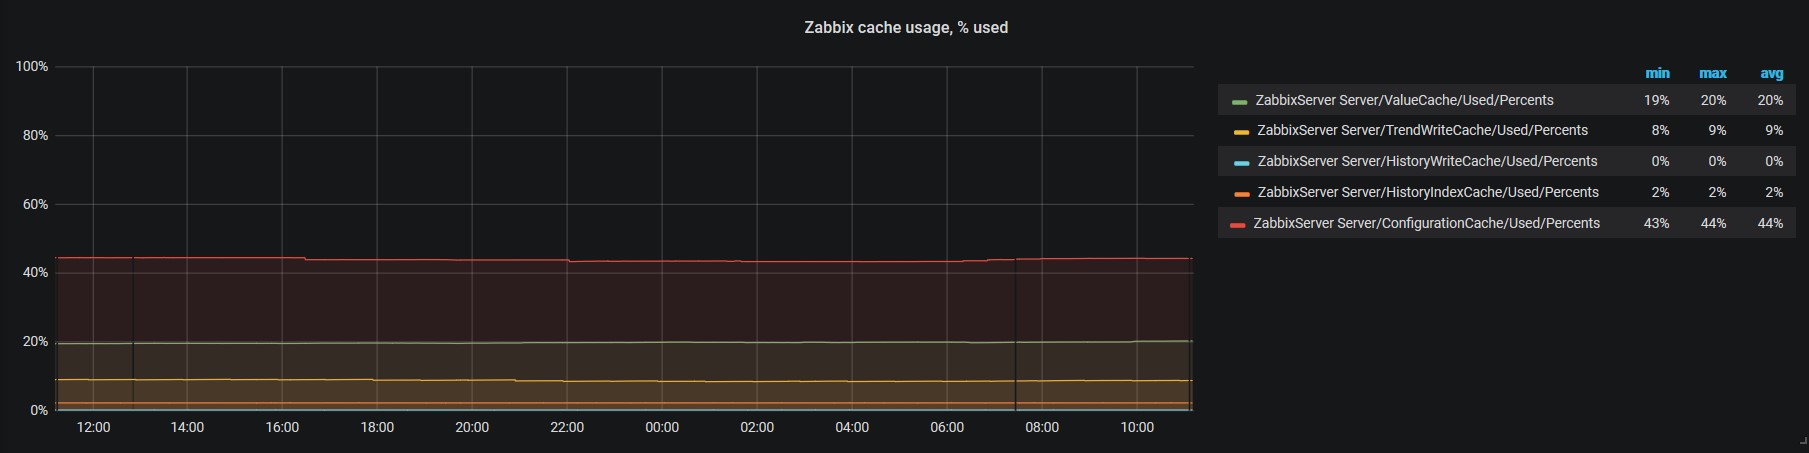
So, here's the graphs for Zabbix server. We don't use Zabbix frontend graphs, instead we use Grafana, hope it's okay. Some poller processes are disabled (vmware, ipmi and some other), so they are not present on the graph.
|
| Comment by Valeriy Zabawski [ 2019 Jul 29 ] |
|
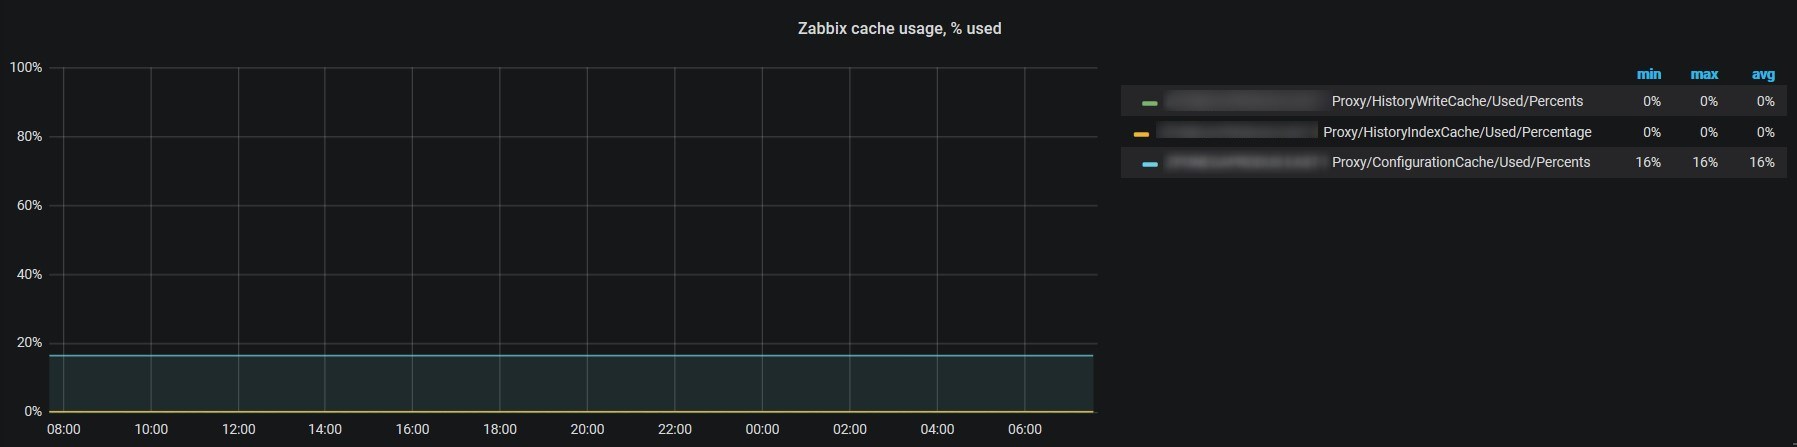
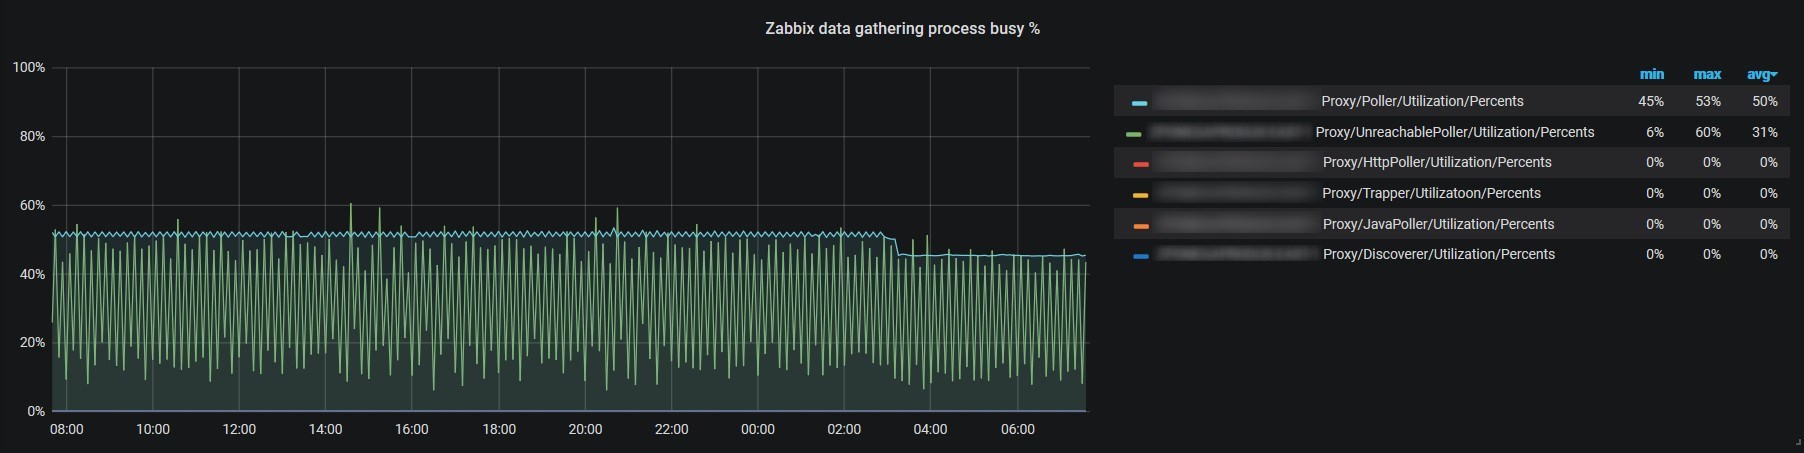
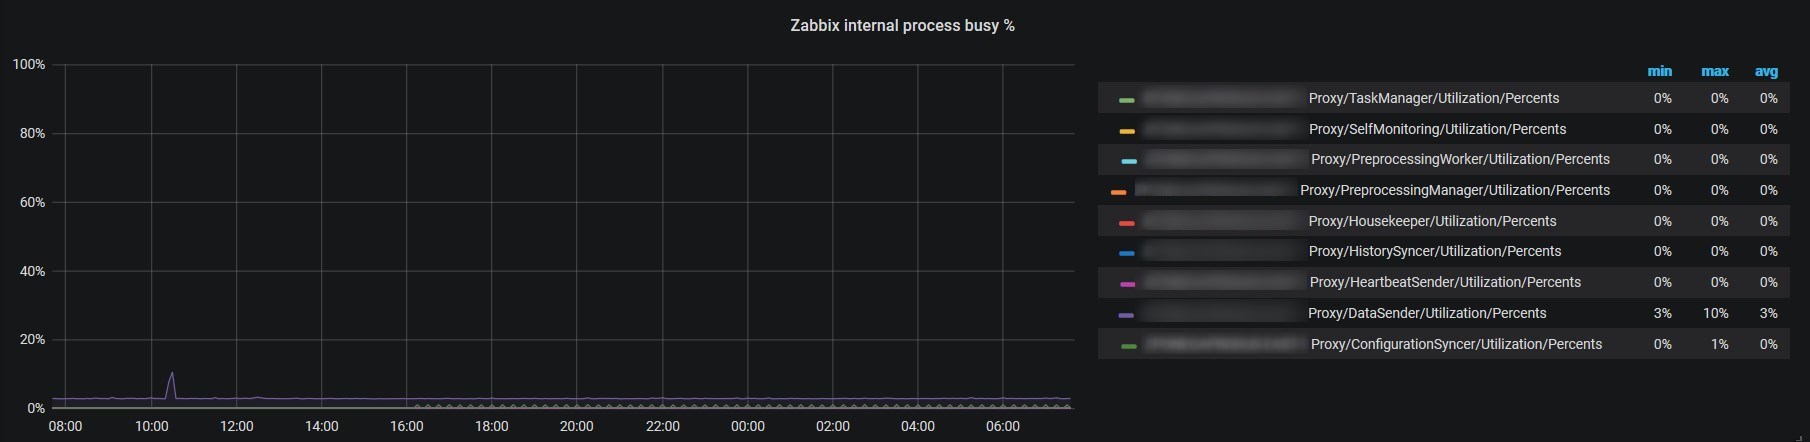
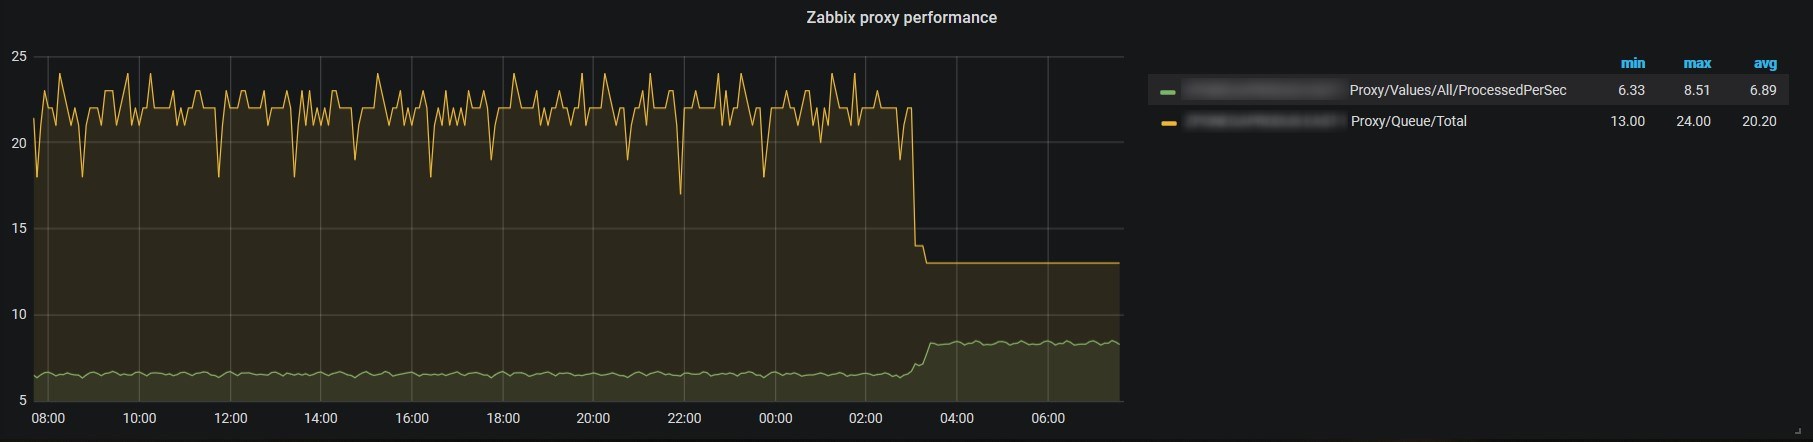
Zabbix proxy graphs within 1 day.
|
| Comment by Edgar Akhmetshin [ 2020 Mar 02 ] |
|
Hello Valeriy, Please provide strace output for trapper process with log file (debug 4 required for the processes) ps aux|grep -i trapper ### to get trapper process number zabbix_server -R log_level_increase=trapper,<Process number> sudo strace -s 256 -T -tt -f -o /tmp/zabbix.trapper.strace.out -p <PID_from_first_step> sudo strace -c -s 100 -T -tt -fp <PID_from_first_step> Regards, |