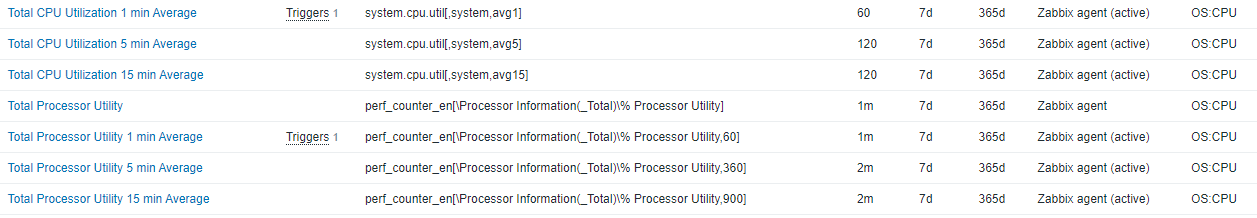
[ZBX-20980] system.cpu.util shows different value than Task Manager on Windows server Created: 2022 May 02  Updated: 2024 Apr 10  Resolved: 2022 Jul 28

Status: Closed
Project: ZABBIX BUGS AND ISSUES
Component/s: Agent (G)
Affects Version/s: 5.0.23, 6.0.4, 6.2.0beta1
Fix Version/s: 6.4 (plan)

Type: Problem report Priority: Trivial
Reporter: Stefan Flores Assignee: Aleksejs Sestakovs
Resolution: Fixed Votes: 0
Labels: agent, cpu, load, windows
Remaining Estimate: Not Specified
Time Spent: Not Specified
Original Estimate: Not Specified

Attachments: Text File 2022_05_03_agent_item.txt     Text File 2022_05_03_perf_counter.txt     PNG File 2022_05_03_task_manager.png     PNG File cpu_items.png     PNG File server_a_1.png     PNG File server_a_2.png     PNG File server_b_1.png     PNG File server_b_2.png    
Issue Links:
Duplicate
is duplicated by ZBX-24218 Monitoramento de CPU Closed
Team: Team B
Sprint: Sprint 89 (Jun 2022), Sprint 90 (Jul 2022)
Story Points: 0.125

 Description   

We are monitoring Windows servers with Zabbix agent. In some cases (not all) we see that the values collected by system.cpu.util are different from the Performance charts of the task manager and also when collecting the same value from the performance counters.


Environment:

  • Zabbix agent: 5.0.17
  • Zabbix server and proxy: 5.0.21


Steps to reproduce:

  1. monitor CPU using built in system.cpu.util
  2. monitor CPU using perf_counter
  3. look at performance charts directly on the server


Result:

Here are two screenshots of two different servers

Server Monitored values Performance tab of task manager
A    
B    


Expected:
I would expect the values collected by system.cpu.util to be similar to the perf_counters and the Permformance tab of the taks manager. A little difference might be acceptable as the values might be collected at different times.


 Comments   
Comment by Stefan Flores [ 2022 May 02 ]

Used Zabbix items


Server A


Server B

Comment by Edgar Akhmetshin [ 2022 May 03 ]

Hello Stefan,

Thank you for reporting the issue. Could you please provide raw values from Zabbix history and from perf_counters, also specify Windows name, version, build version.

Regards,
Edgar

Comment by Andris Mednis [ 2022 May 03 ]

Can you compare with Perfmon data?

Comment by Stefan Flores [ 2022 May 03 ]

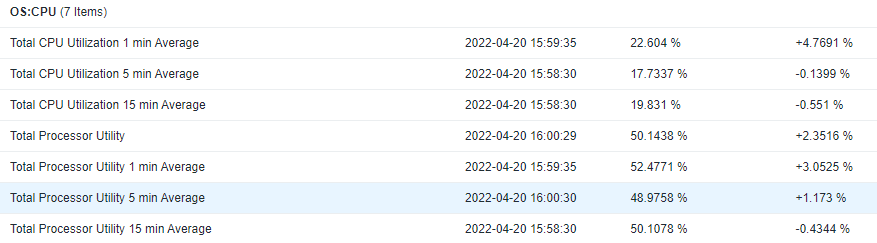
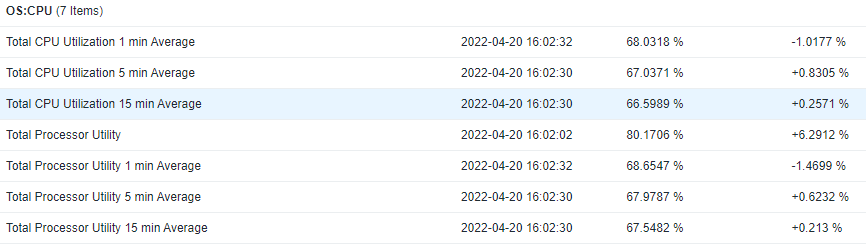
Here are the latest 500 value

Agent item

2022_05_03_agent_item.txt


Perf_counter

2022_05_03_perf_counter.txt


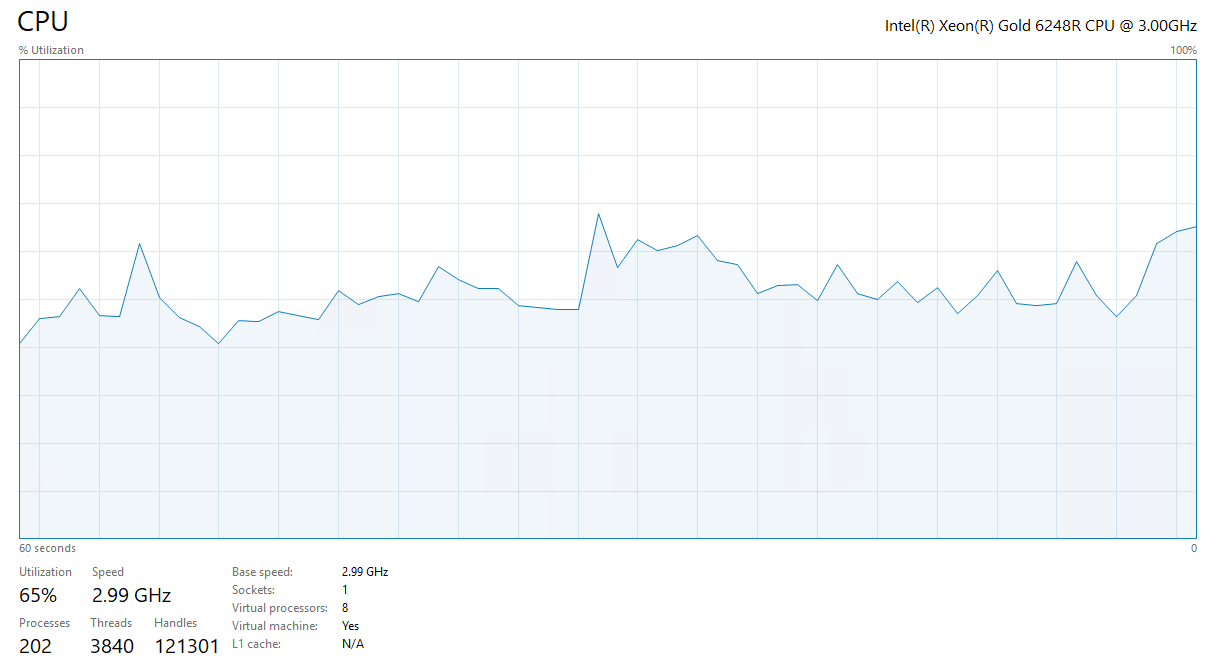
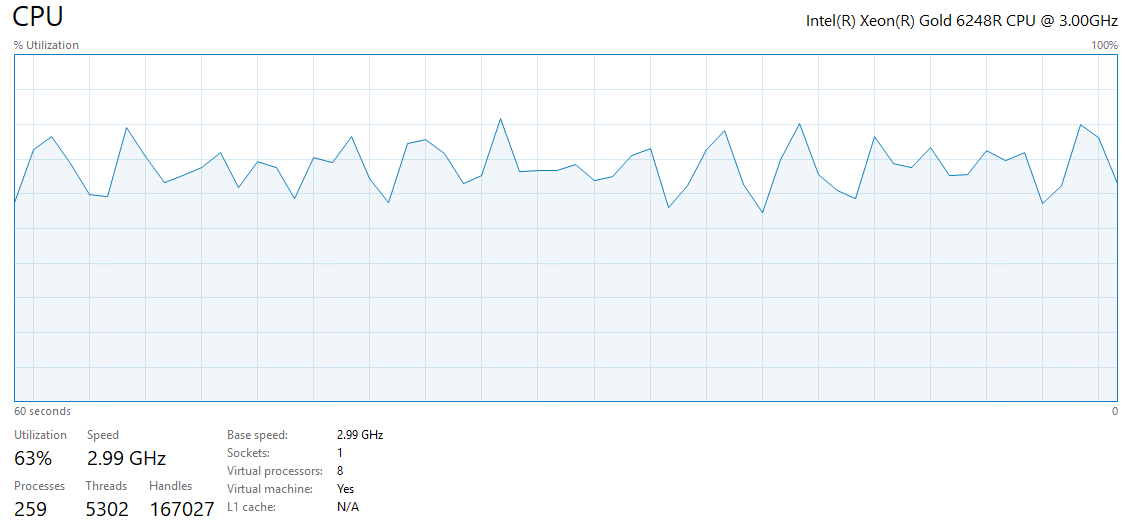
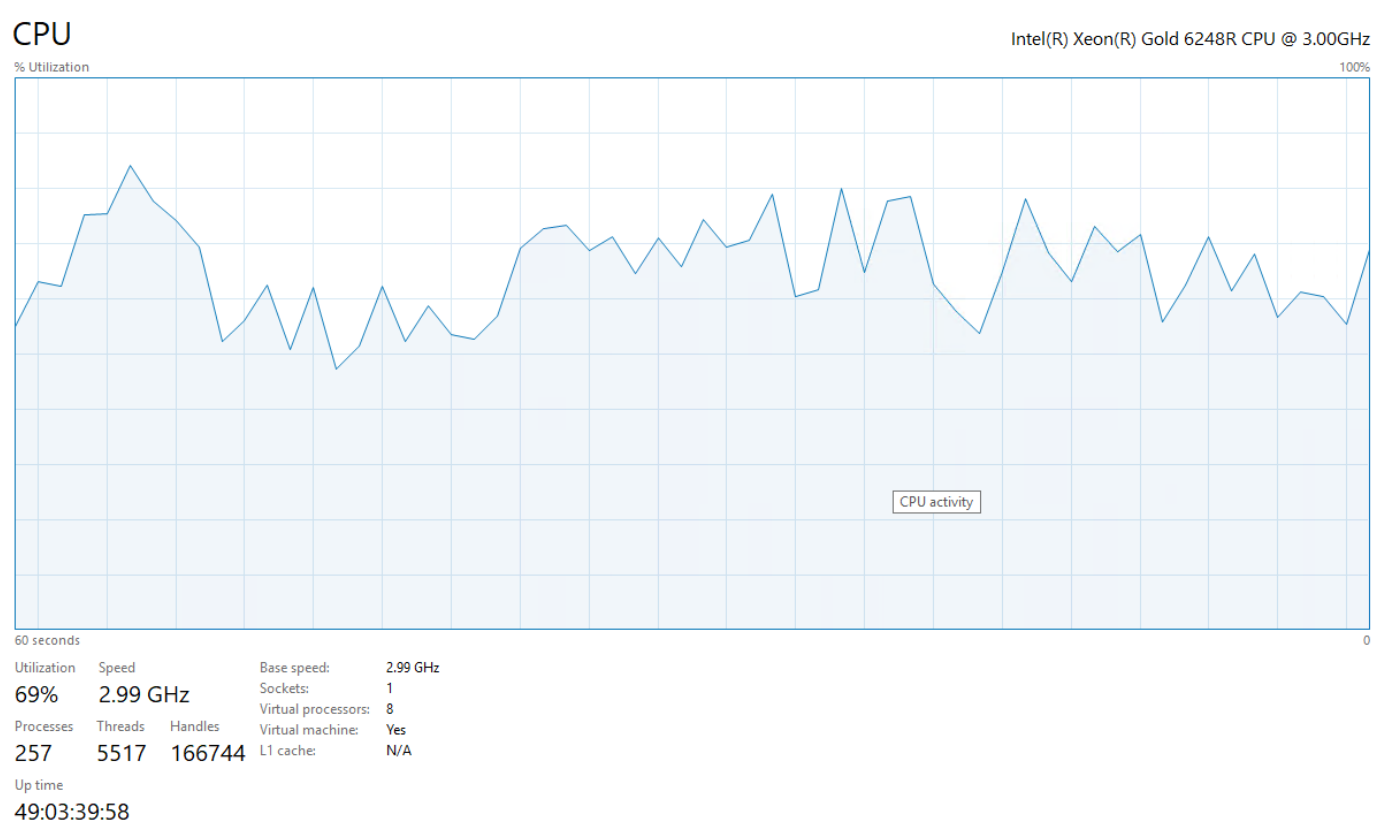
Screenshot of task manager at the same time

Comment by Edgar Akhmetshin [ 2022 May 05 ]

Hello Stefan,
Thank you for the information, two more questions - from screenshot i can see Intel® Xeon® Gold 6248R which is a 24 core 48 threads (and VM has 1 socket/8 cores), please confirm if this is a dual socket server and second socket is populated? And second - operating system build and version? This information will help our DEV team.

Confirmed.

Regards,
Edgar

Comment by Stefan Flores [ 2022 May 05 ]

It is a virtual machine and the underlying HW has 2 CPU with 96 cores.

BTW: the monitored virtual machine is "Windows Server 2019 Standard, version 1809, OS build 17763.2686"


I hope this helps

Comment by Michael Veksler [ 2022 Jul 22 ]

Documentation update available in 6a7226a3c18

Comment by Martins Valkovskis [ 2022 Jul 25 ]

It has been decided to document that the proc.cpu.util[] item on Windows uses the Processor Time performance counter, while since Windows 8 its Task Manager shows CPU utilization based on the Processor Utility performance counter; in previous versions it was the Processor Time counter.

The documentation of the proc.cpu.util[] item has been updated accordingly for the supported versions: 4.0, 5.0, 6.0, 6.2, 6.4.

Generated at Fri May 02 06:46:50 EEST 2025 using Jira 9.12.4#9120004-sha1:625303b708afdb767e17cb2838290c41888e9ff0.