|
Causes |
|||
| caused by |
|
Vector graph widget improvements | Closed |

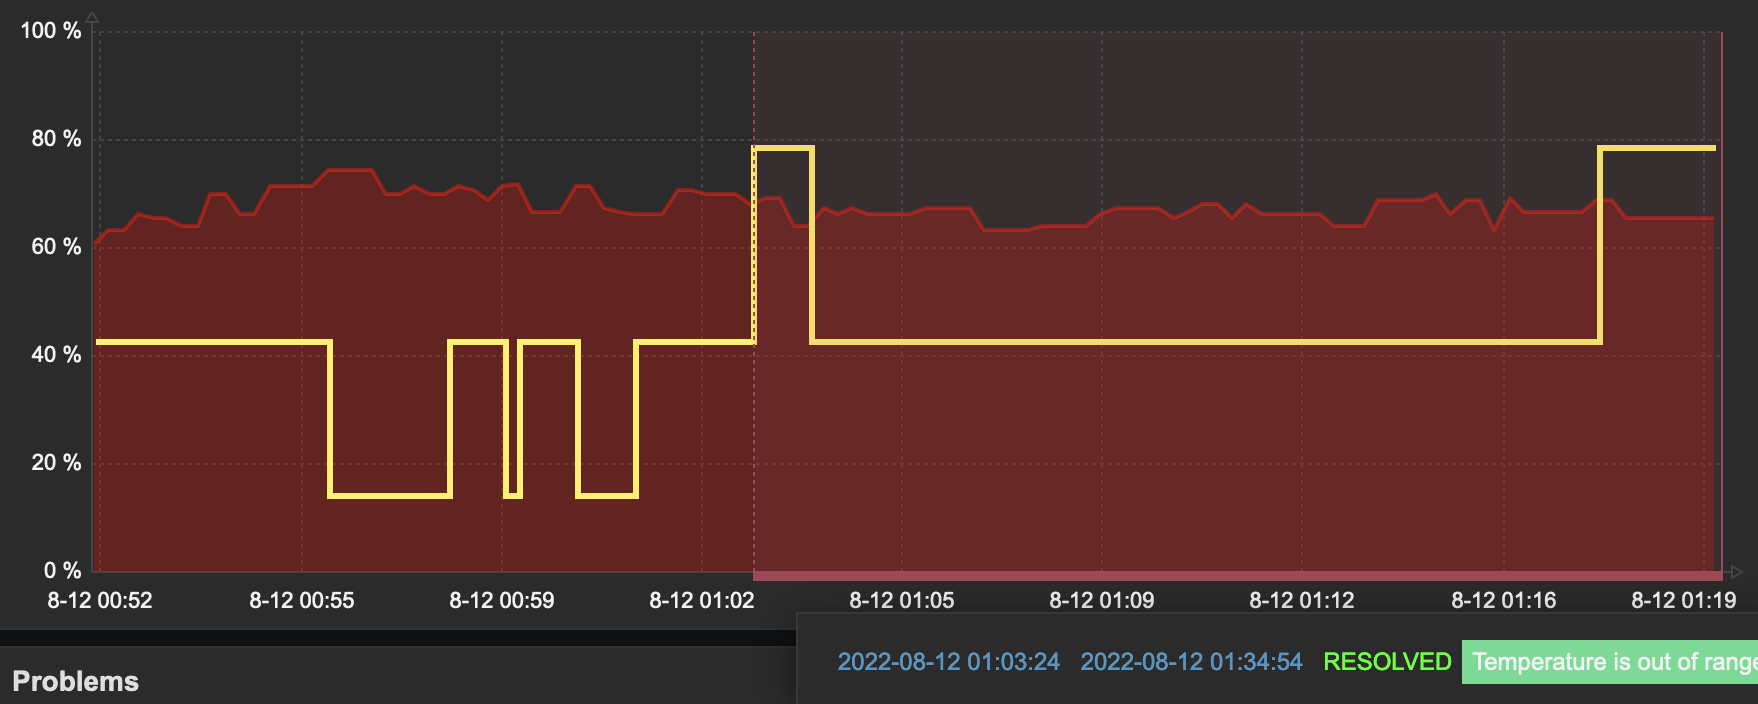
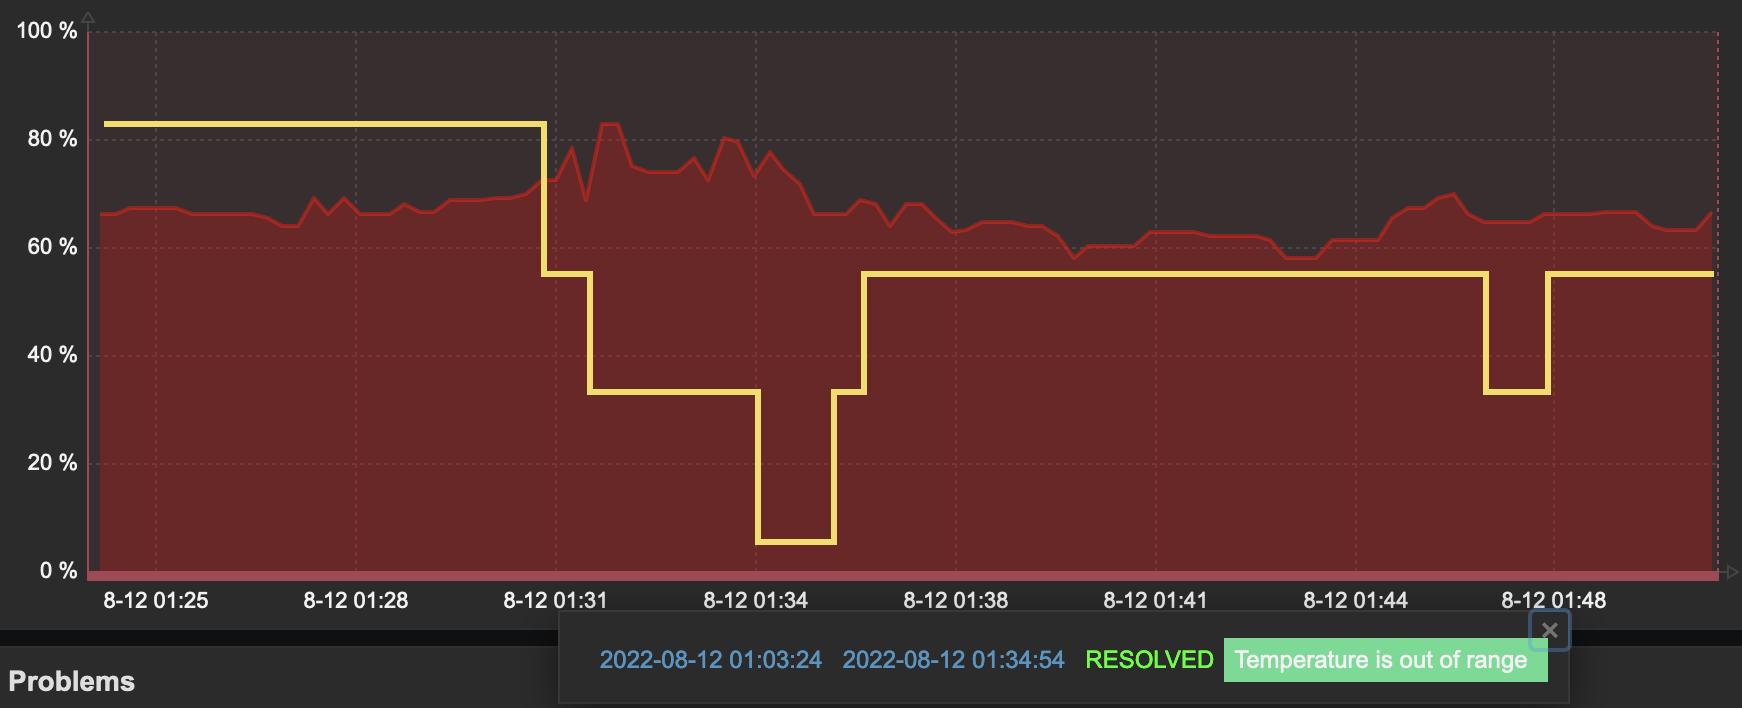
[ZBX-21472] Graph widget incorrectly shows the problem period Created: 2022 Aug 15 Updated: 2024 Apr 10 Resolved: 2022 Dec 12 |
|
| Status: | Closed |
| Project: | ZABBIX BUGS AND ISSUES |
| Component/s: | Frontend (F) |
| Affects Version/s: | None |
| Fix Version/s: | 6.2.7rc1, 6.4.0beta5, 6.4 (plan) |
| Type: | Problem report | Priority: | Trivial |
| Reporter: | Alexander Vladishev | Assignee: | Reinis Detlavs (Inactive) |
| Resolution: | Fixed | Votes: | 0 |
| Labels: | None | ||
| Remaining Estimate: | Not Specified | ||
| Time Spent: | Not Specified | ||
| Original Estimate: | Not Specified | ||
| Attachments: |
|
||||||||
| Issue Links: |
|
||||||||
| Team: | |
||||||||
| Sprint: | Sprint 91 (Aug 2022), Sprint 92 (Sep 2022), Sprint 93 (Oct 2022), Sprint 94 (Nov 2022), Sprint 95 (Dec 2022) | ||||||||
| Story Points: | 1 | ||||||||
| Description |
|
Steps to reproduce:
|
| Comments |
| Comment by Reinis Detlavs (Inactive) [ 2022 Sep 14 ] |
|
Fixed in development branch feature/ZBX-21472-6.2. |
| Comment by Reinis Detlavs (Inactive) [ 2022 Dec 09 ] |
|
Implemented in:
|