-
Type:
Change Request
-
Resolution: Fixed
-
Priority:
Trivial
-
Affects Version/s: None
-
Component/s: Frontend (F)
-
None
-
Sprint 80 (Sep 2021), Sprint 81 (Oct 2021), Sprint 82 (Nov 2021), Sprint 83 (Dec 2021), Sprint 84 (Jan 2022), Sprint 85 (Feb 2022), Sprint 86 (Mar 2022), Sprint 87 (Apr 2022), Sprint 88 (May 2022), Sprint 89 (Jun 2022), Sprint 90 (Jul 2022), Sprint 91 (Aug 2022)
-
2
Summary
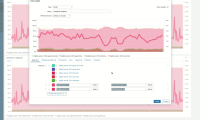
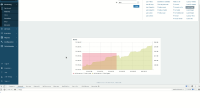
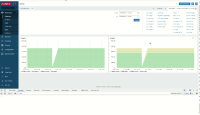
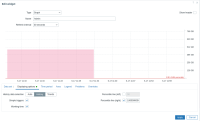
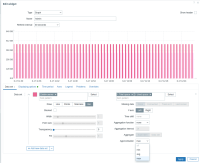
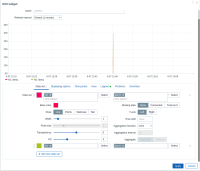
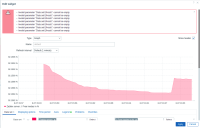
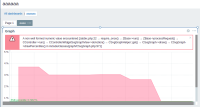
On the way to the modern and good-looking UI, Zabbix must remove old-style PNG graphs in favor of the new vector ones. To achieve this, the following steps must be taken:
- Improve vector graphs widget:
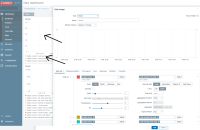
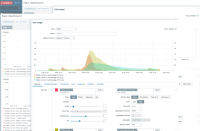
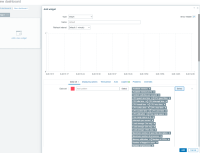
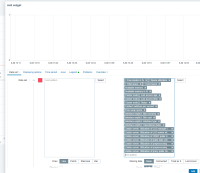
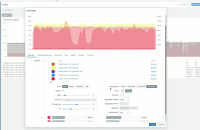
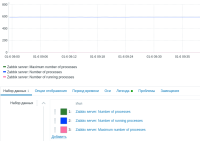
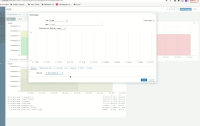
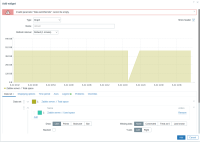
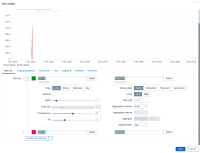
- Add stacked graphs, add the ability to reference items by ids, other visual changes
- Add pie charts
- Replace PNG graphs with vector graphs in Latest data
- Replace PNG graphs with vector graphs in Hosts and Dashboards
This document describes step 1a.
Use cases
- I want to use vector graphs widgets the same way I use PNG ones.
- I want to display missing data for throttled items.
- I (as a Zabbix developer) want to prepare for graph changes in the Latest data and other forms.
- causes
-
ZBX-21472 Graph widget incorrectly shows the problem period
-
- Closed
-
-
ZBX-21489 Graph widget multiselect layout and overrides drag and drop option
-
- Closed
-
-
ZBX-22350 Vector Graph Aggregations Broken For Datasets
-
- Closed
-
-
ZBX-22915 Dashboard pages do not focus when clicked in dashboard editing mode
-
- Closed
-
-
ZBX-23919 Widget graph's option Display min/max/avg broke legend
-
- Closed
-
