|
Duplicate |
[ZBX-22786] Trends graph line colors Issue with PHP 8.1+ Created: 2023 May 11 Updated: 2023 May 12 |
|
| Status: | Confirmed |
| Project: | ZABBIX BUGS AND ISSUES |
| Component/s: | Frontend (F) |
| Affects Version/s: | 6.0.17 |
| Fix Version/s: | None |
| Type: | Incident report | Priority: | Trivial |
| Reporter: | Kim Jongkwon | Assignee: | Zabbix Development Team |
| Resolution: | Unresolved | Votes: | 2 |
| Labels: | None | ||
| Remaining Estimate: | Not Specified | ||
| Time Spent: | Not Specified | ||
| Original Estimate: | Not Specified | ||
| Environment: |
PHP 8.1+ |
||
| Attachments: |
|
||||
| Issue Links: |
|
||||
| Description |
|
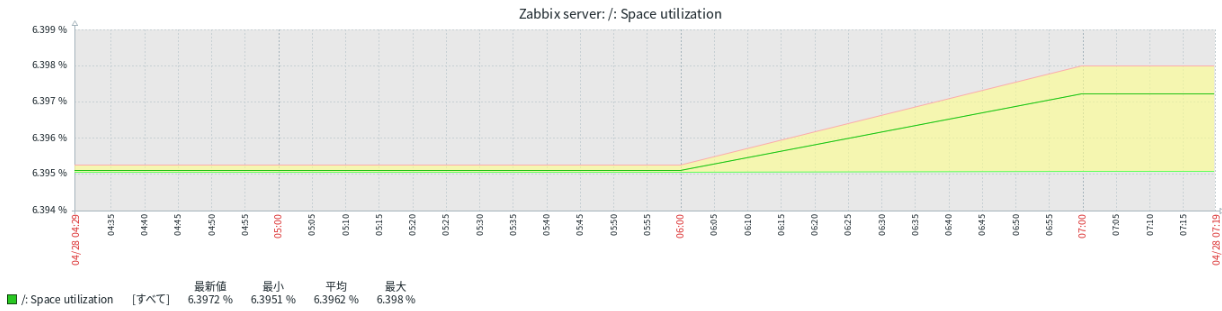
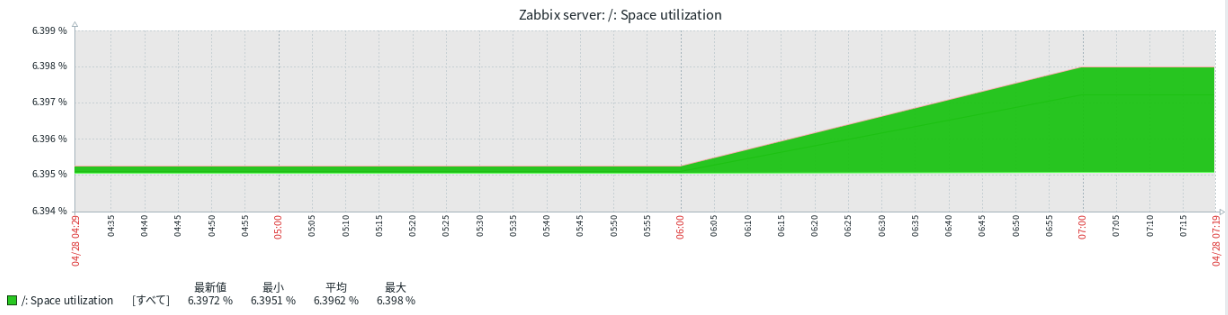
We have identified an inconsistency in rendering trend data graphs after upgrading to the version of PHP (8.0 -> 8.1+) Please see the attached images for reference:
In Zabbix documentation, For data that show a longer period three lines are drawn - a dark green one shows the average, while a light pink and a light green line shows the maximum and minimum values at that point in time. The space between the highs and the lows is filled with yellow background. However, after upgrading to PHP 8.1 and above, this documented behavior isn't observed. |