|
chirrut
Is the issue reproducible with the "GODEBUG=madvdontneed=1" flag ?
e.g. " GODEBUG=madvdontneed=1 ./sbin/zabbix_agent2 -c /home/arimdjonoks/zabbix/etc/zabbix_agent2.conf"
Previously, I encountered that this is a native behavior for golang to continuously use more and more rss memory.
Essentially it comes down to golang garbage collector marking the freed memory with MADV_FREE which tells OS - "i am not using this memory, but keep assigned it to me, once other processes request it - then you can deallocate it from me entirely".
There is a way to disable this behavior by using this madvdontneed flag.
This could very well be unrelated to the problem and be a legitimate issue. Please check this flag, while I am investigating what else could be the problem.
|
|
The following code must be fixed, it should only call malloc after log level is checked and it is going to log something:
void __zbx_zabbix_log(int level, const char *format, ...)
{
	if (zbx_agent_pid == getpid())
	{
		va_list	args;
		char *message = NULL;
		size_t size;

		va_start(args, format);
		size = vsnprintf(NULL, 0, format, args) + 2;
		va_end(args);
		message = (char *)zbx_malloc(NULL, size);
		va_start(args, format);
		vsnprintf(message, size, format, args);
		va_end(args);

		handleZabbixLog(level, message);
		zbx_free(message);
	}
}
<arimdjonoks> This does look like something we could fix in this ticket as an extra, but this should not be the cause of the memory leak.
RESOLVED in 5e414711a2f
<andris> Successfully tested. CLOSED
|
|
Hi!
GODEBUG=madvdontneed=1 tested -->
The Agent runs ~30min and the Memory increased starting from 25MB to 48MB.
br,
Daniel
|
|
Hi!
I have similar issues with zabbix-agent2 in version 6.4.4, revision a749236b3d9 on Ubuntu 22.04
Kind regards
|
|
ThickDrinkLots, there seems to be no issue.
Please provide information that would suggest otherwise.
|
|
Sorry, now I see this issue is related to log monitoring, which I don't have enabled.
But I had version 6.4.4 installed on several AWS EC2's and on all of them zabbix-agent slowly drained memory. On machines with 1GB of RAM it caused some OOM messages to be thrown (not by agent itself, but by locate's updatedb for example) and the machine being completely unresponsive. A restart of zabbix-agent2 service is a solution for about 5-7 hours.
As a workaround, I installed version 6.0 LTS, but I can reinstall 6.4.4 on some test machines to reproduce this strange behavior. If you need me to run some commands to provide more details, please let me know.
Sorry for the confusion.
|
|
@arimdjonoks
What do you mean by, "there seems to be no issue"?
We have at least 20 Systems with exact the same Problem. The memory usage of this agents is annoying high.
Excerpt from today: (24h runtime!!!)
Address Kbytes RSS Dirty Mode Mapping
---------------- ------- ------- -------
total kB 9656396 4969084 4952456
total kB 6277280 3096092 3079392
total kB 5954220 3108472 3091504
total kB 6154340 3111732 3094716
total kB 6514800 3154036 3137476
total kB 6193992 3154872 3138204
total kB 5800484 3650960 3634136
total kB 7172020 3153072 3136404
total kB 9745384 5117148 5100508
total kB 6548076 3088624 3071780
total kB 8096352 5147700 5130960
total kB 7329760 3108960 3091904
total kB 8472232 5212468 5195740
total kB 5750296 3151756 3135148
total kB 12170964 9066636 9050024
total kB 7229616 3155976 3139372
total kB 4362528 2329532 2312856
total kB 5764216 363108 322980
total kB 5651572 362068 323808
total kB 3194960 1311408 1304536{}
If you need some more debugging info just ask...
<arimdjonoks>
I am saying "there seems to be no issue" is because, just the fact that application uses more and more memory - does not on its own prove there is a memory leak. I need to see that memory is increasing over long period of time, and is also never recovered back.
Please provide me with more detailed information, the only thing i see is just an output from unknown tool for unknown processes.
I need to know exactly how did you measure the memory used. (tool used, its version, its parameters, etc.)
I need to see some measurements over the last 24 hrs. (graph would be ideal)
Also, which templates/items you use ?
Did you notice that the particular items could be causing this ?
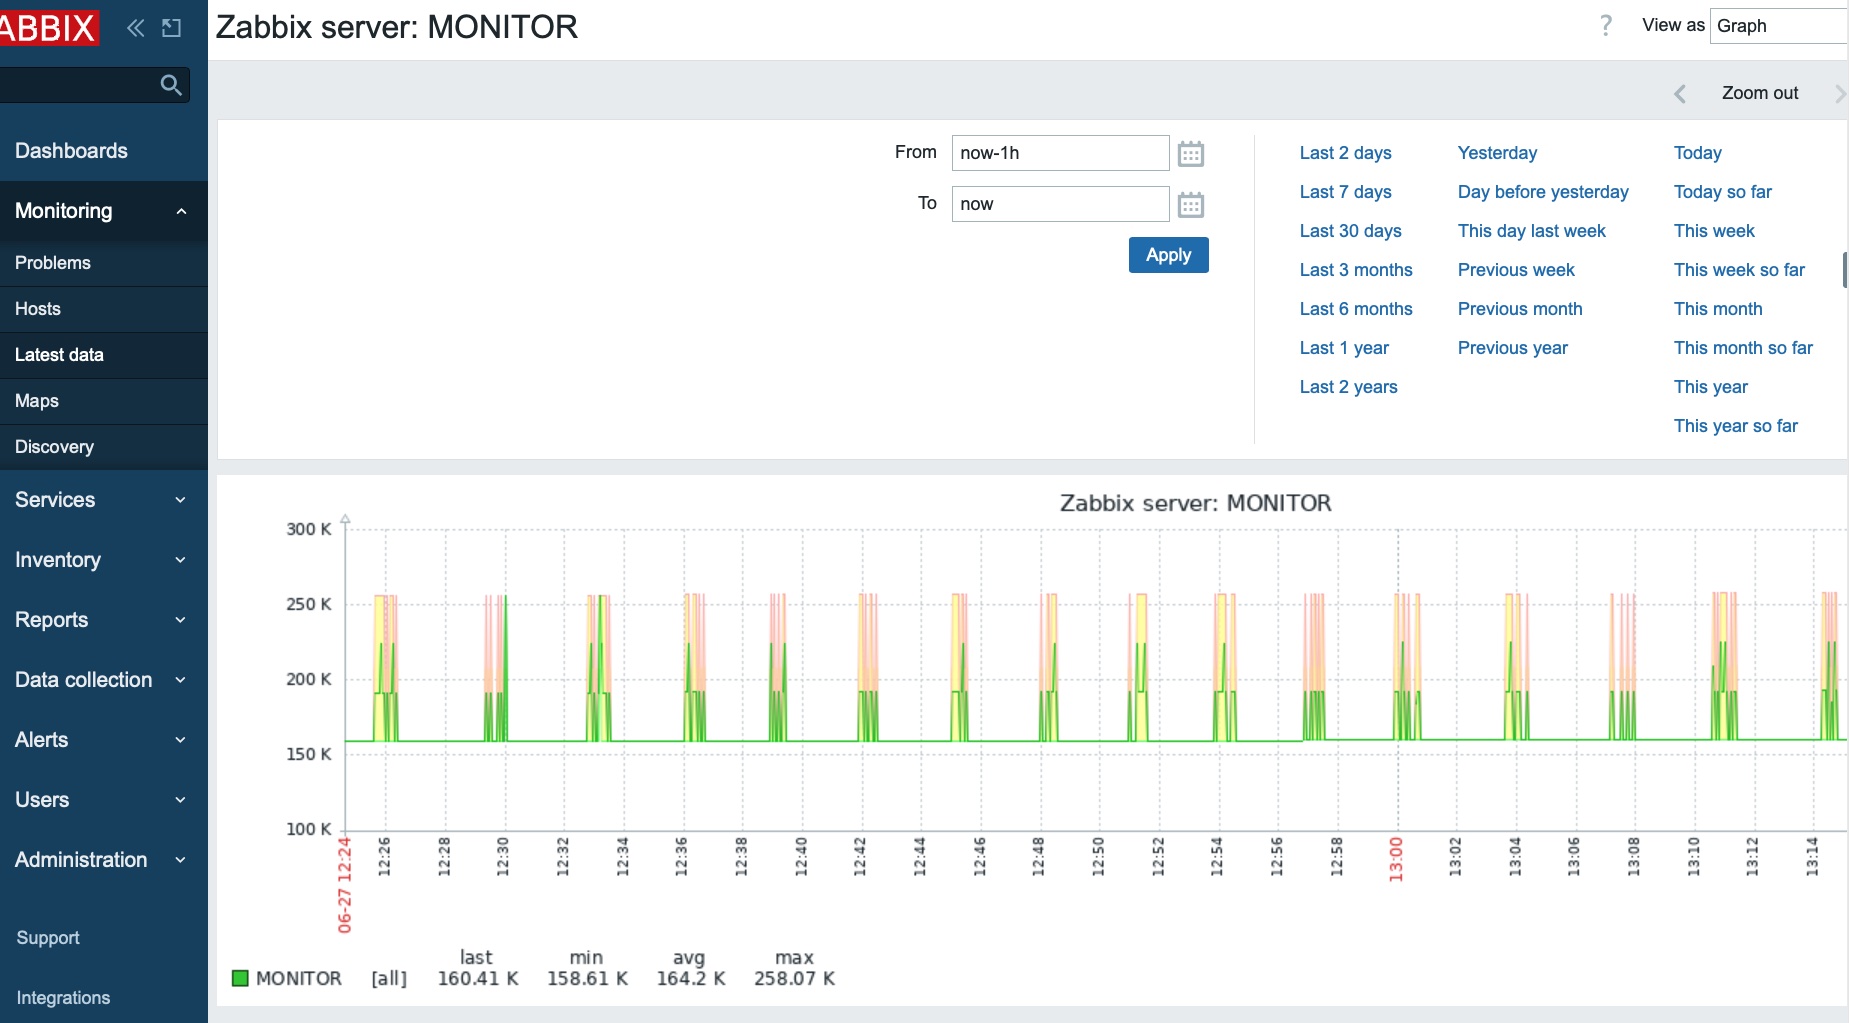
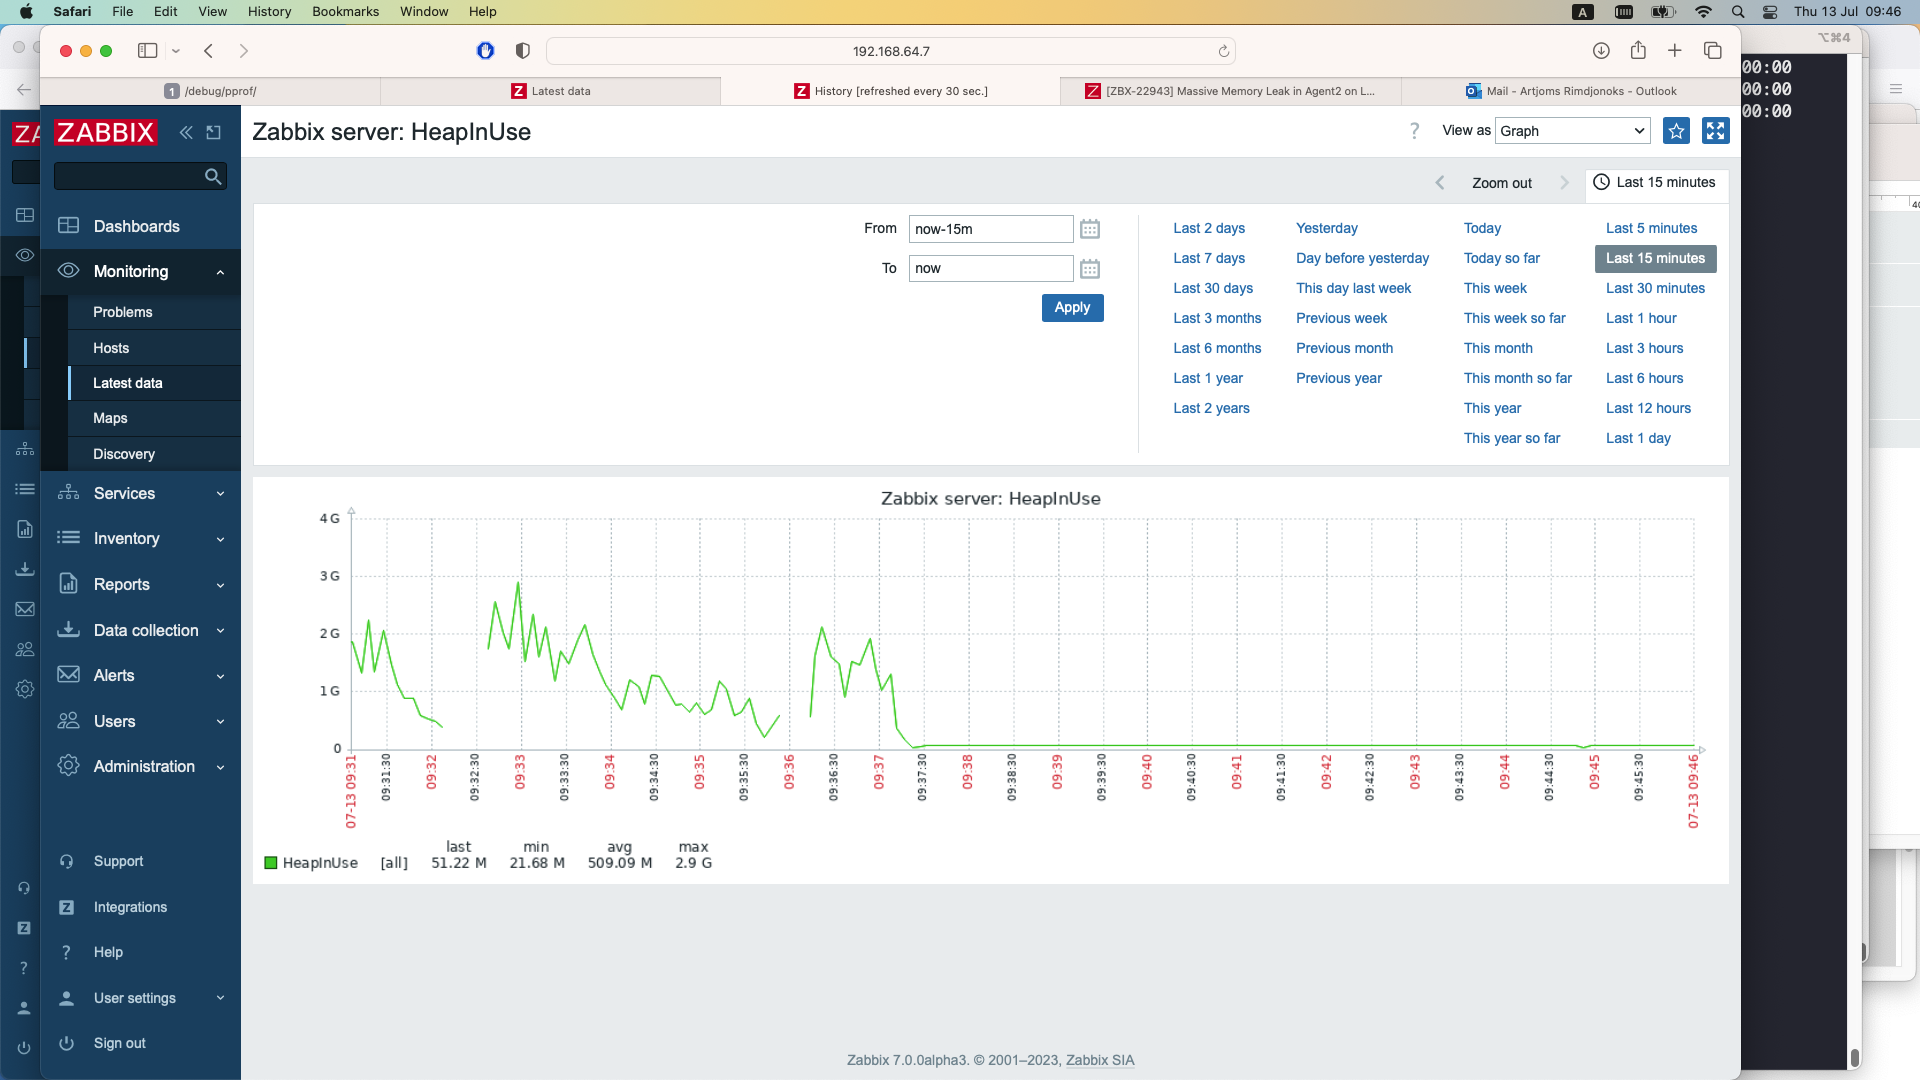
I have been testing agent2 myself memory usage with standard templates and various log items and I got the result like:
(this is basically a zabbix items that reads "/proc/<agent 2 PID>/status" and extracts VmData).
This indeed does contain large spikes of memory usage, but then it goes back, (which seems like how garbage collection works in go)
|
|
Hi,
please refer to the Ticket header:
Measurement:
watch -n 1 "pmap -x $(pgrep zabbix_agent2) | tail;echo; ps -Tf -p $(pgrep zabbix_agent2) | wc -l"
Check the RSS and Dirty Value, both increases slow, but steadily. The usage is slightly wobbeling around +-2MB.
Version:
[root@ ~]# pmap -V
pmap from procps-ng 3.3.10
Graph:
About a graph, im going to generate one.
Templates:
No we have created some Logmonitors for Oracle Logfilemonitoring
key full: log[/u01/app/oracle/diag/rdbms/.../trace/alert_XYZ.log,@alertlog_selected]
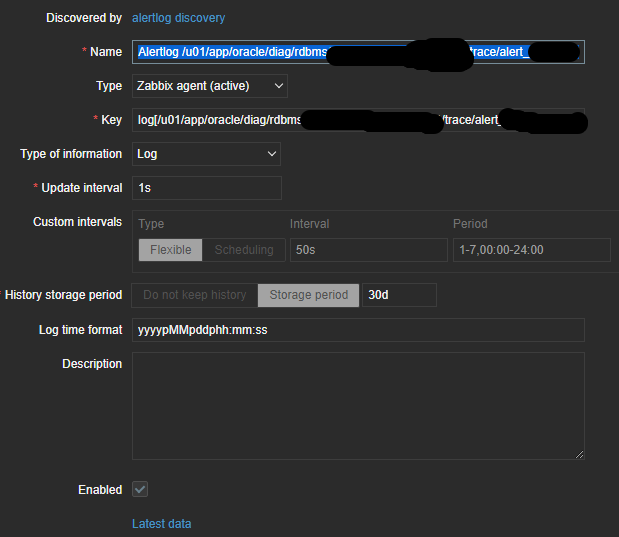
It is ok, if the Memory is peaking a little bit, but not multiple gigabytes. As mentioned above, same configuration will not rise any issue on the agent (1) memory usage.
|
|
Update - at least in my case issue may not be related to the zabbix-agent2 in the 6.4.4 version. After I made a downgrade to the 6.0.19 I'm still having similar symptoms.
|
|
Investigation 2
I extensively tested the items with log[<x>,<y>...] pattern with Zabbig Agent 2 using pprof (go standard tool for investigating memory leaks), and I see no any signs of memory leaks present.
1) I created 1000 items (using LLD):
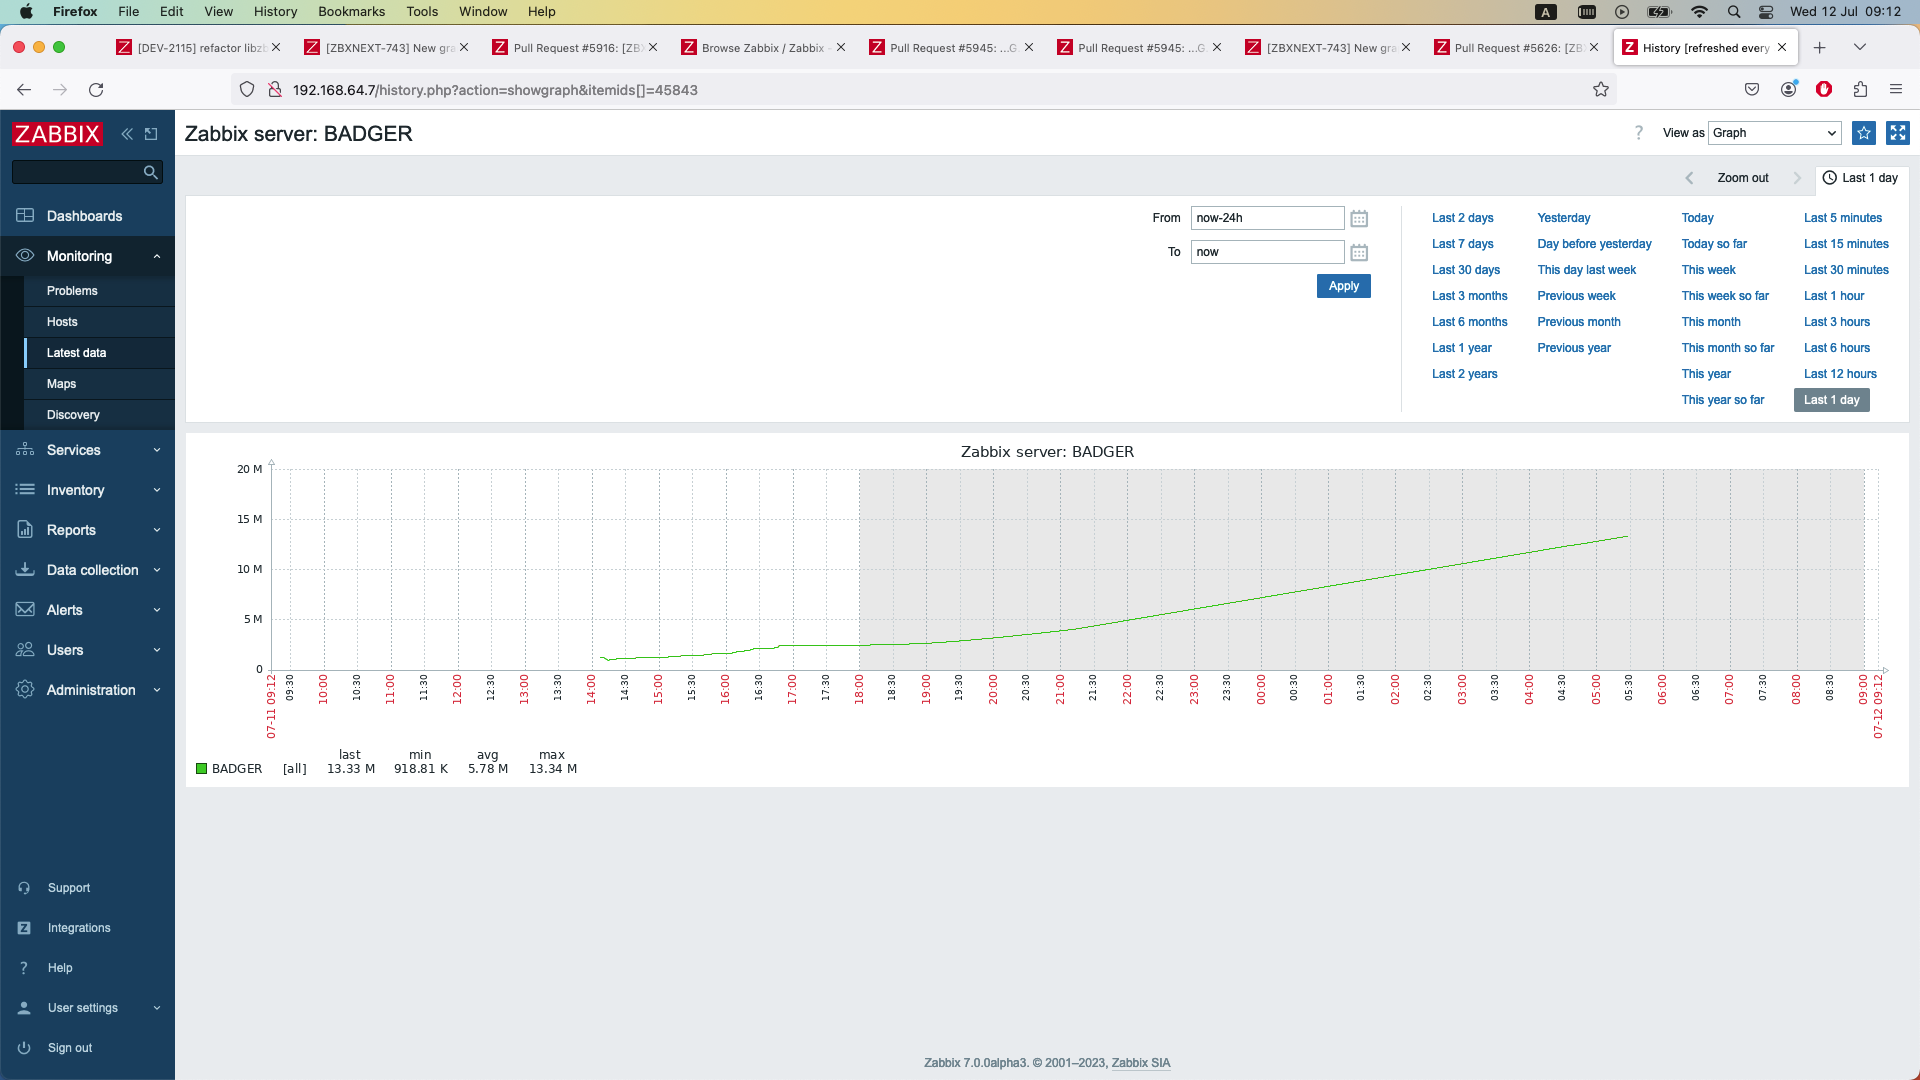
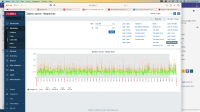
2) Result graph for
item:
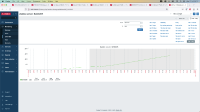
does look like memory is indeed increasing.
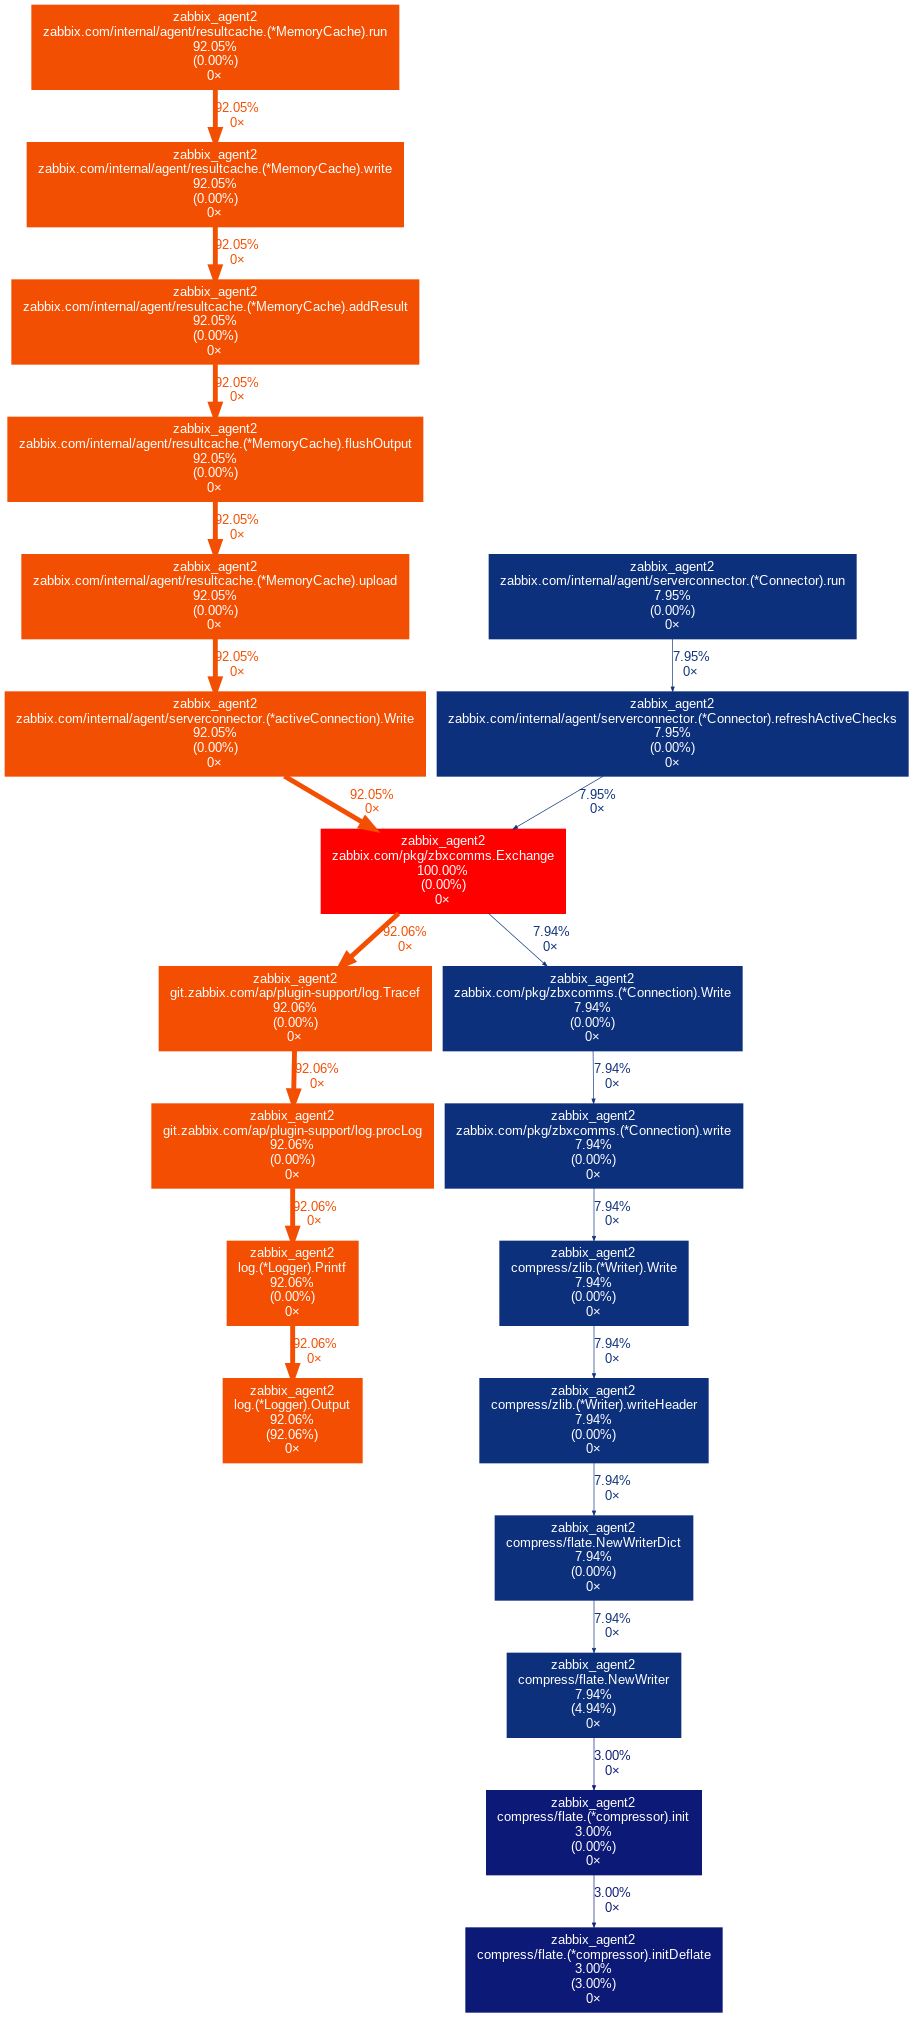
3) Generated pprof report using:
pprof callgrind heap report1 :
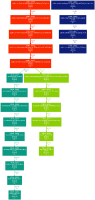
and with 40 minutes difference report2:
notice, how ProcessLogCheck increased from 4% to 27%, this does indeed looks suspicious.
After several hours I deleted all items, and then rechecked the proof graph:

There is no ProcessLogCheck present anymore, the heap memory with it was removed by go. So there is no heap memory occupied by Zabbix Agent 2 log processing logic, which indicates to me there is no memory leak.
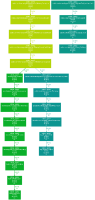
4) Heap-memory tracking
pprof produces heap reports with actual numbers like:
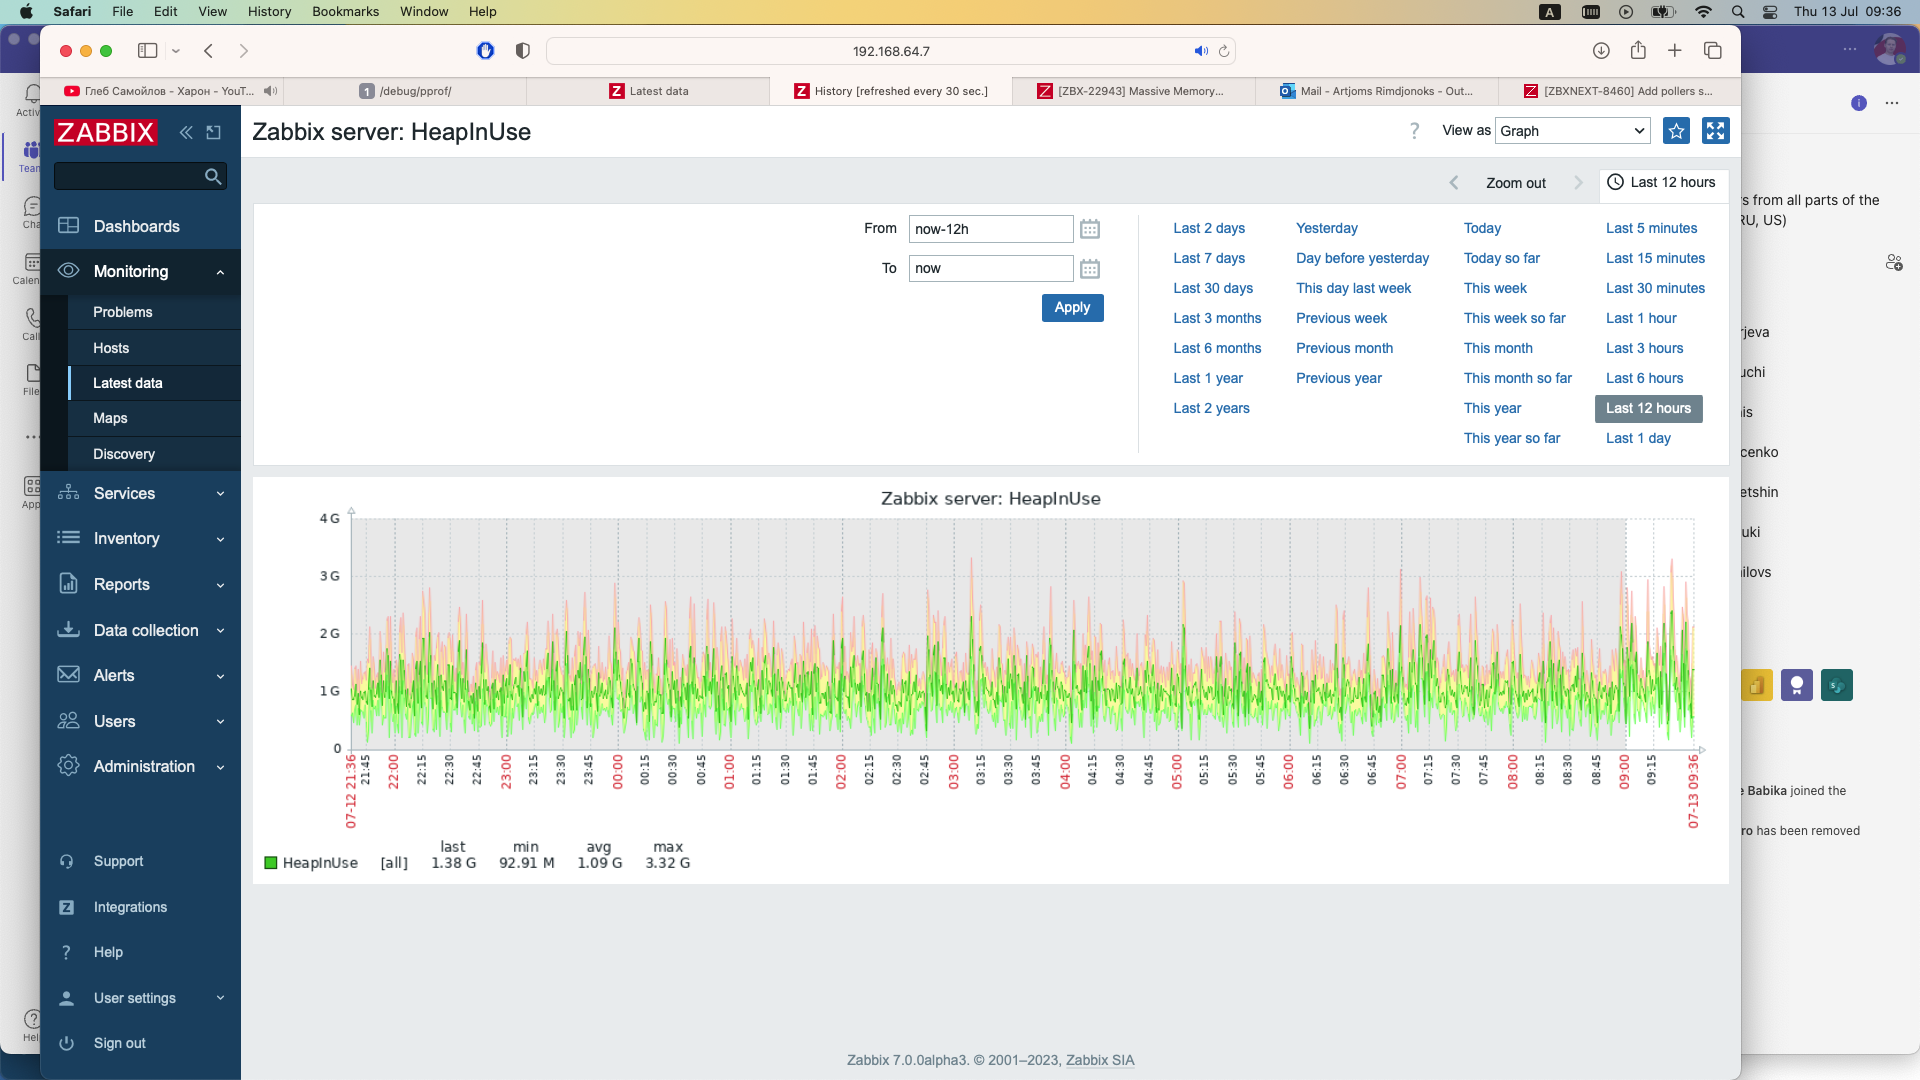
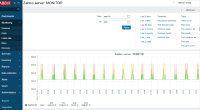
I have been tracking with Zabbix the HeapInuse field.
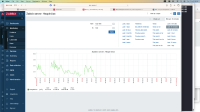
Result over the last 12hr with thousand of items:
After I delete them, it goes back:
5) vfs.file.regexp[/proc/1275615/status,"VmData"] data after 12 hr extensive testing and deletion of all test items increased to 7 Mb in the meantime.
Conclusion
I see no evidence of memory leak, I see that golang is slowly consuming memory. But the rate at which it does that - does not not look suspicious to me.
Feel free to comment on my finding and suggest improvements.
(I actually found a small memory leak, but that was relatively edge-case and could not be the cause of any significant memory consumption. This will be fixed as part of this ticket. ZBX-23107)
|
|
Sorry the attachments got uploaded by accident. https://support.zabbix.com/browse/ZBX-23349 this is where you can find them if you need them.
If you want me to also upload them here please let me know.
|
|
Caused by DEV-2137
https://git.zabbix.com/projects/ZBX/repos/zabbix/commits/ad7cb6607
Also:
https://git.zabbix.com/projects/ZBX/repos/zabbix/commits/f583f58541cd9add667d0c2d3544f5068571f8f6#src/go/pkg/zbxlib/logfile.go
|
|
Is it possible to test whether the leak is gone if we provide a patch or it's better when new version is released ? martsupplydrive
|
|
Yes, I am happy to assist. If there is a patch available I will apply it to some of my servers. I may need some help updating the agents from sources since I update mine from packages normally.
|
|
martsupplydrive
we have the fix available for test for the following branches:
feature/ZBX-22943-6.5
feature/ZBX-22943-6.4
feature/ZBX-22943-6.0
We are planning to include the fixes to closes releases, but if you could test any of them and provide early feedback - that would be great, thank you.
|
|
Available in versions:
Note: fixes cover tls connections, log items and eventlog (Windows) items.
|
|
I will start testing today and give an update in a few hours to see if i can notice a difference.
|
|
I installed the 6.4.7RC1 build on 2 of my servers. I restarted one of the "older (6.4.6)" Agents on another server with similar logfile checks so i can compare them.
So far it looks like the RC build performs better. The amount of memory used by the RC is around half of what the 6.4.6 uses atm. The servers are similar but not identical so because of that i dont want to make an early conclusion.
With the previous version the memory increased around 250/300 MB a day and so far i havent seen that. I dont want to say for sure that is has been solved since it has only been around 8 hours since the agents started. But so far so good.
I will monitor the Agents performance for the next couple of days and post updates here.
|
|
New Update:
Looking at the data from this weekend i can clearly see a Major improvement. The memory usage is as expected and it starts to level like it did before.
The 6.4.6 Agent i restarted at the same time as the 6.4.7RC1 Agent uses 4 times as much memory on a similar system and settings.
|
Generated at Wed Feb 04 11:40:25 EET 2026 using Jira 10.3.13#10030013-sha1:56dd970ae30ebfeda3a697d25be1f6388b68a422.