|
After analyzing this problem on our side, we have the following conclusions:
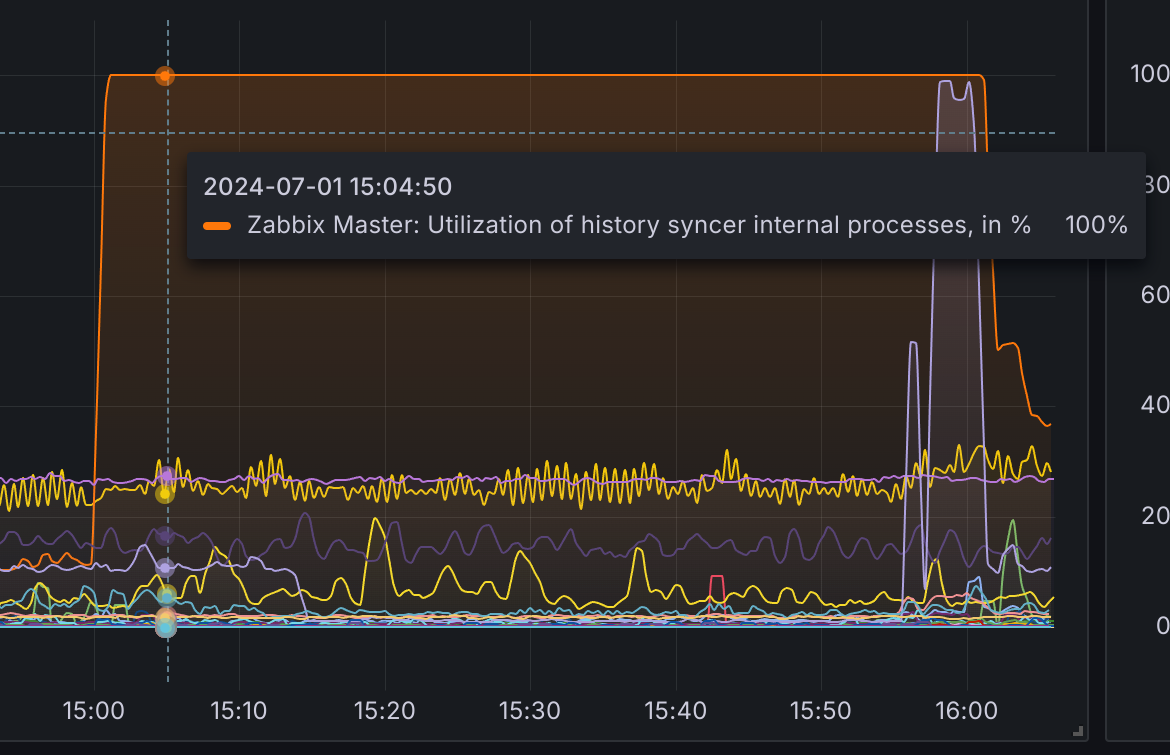
- the 'trends' and 'trends_uint' tables in our environment are problematic. in addition to the above errors, we also have problems during normal operation of zabbix. Sometimes it creates "holes" - syncers get blocked (probably due to the same problem), and after some time (~5 min) syncers will process the data and catch up with the data that had to wait.
- the problem is when during this query one of the ITEMIDs does not have a trend in a given time interval - postgresql has to search the entire table for one ITEMID. When we have about 1000 in this query (none of ITEMIDs are present) - the query takes up to 30 minutes.
- we use the timescaledb extension, but our trends tables have grown very large:
trends and latest chunk:
zabbix=# select count(*) from trends;
    count
------------
  2986117705
(1 row)
zabbix=# select count(*) from _timescaledb_internal._hyper_6_1328_chunk;
    count
-----------
  718816405
(1 row)
trends_uint and latest chunk:
zabbix=# select count(*) from trends_uint;
    count
------------
  9277173205
(1 row)
zabbix=# select count(*) from _timescaledb_internal._hyper_7_1327_chunk;
    count
------------
  1633955881
(1 row)
trend settings - 365 days, data from only 8 months.
Such huge tables (and the latest chunk) can also be a problem with such a query (chunk_time_interval - 30 days)
- We repeated the tests of the above SELECT and found that it was due to the use of the DISTINCT filter. We repeated the tests on a smaller number of elements and obtained the following results:
EXPLAIN analyze select distinct  itemid from trends where clock>=1689588000 and (itemid in (14758658,14758660,14758666,14758671,14758678,14758680) or itemid in (14758686,14758691,14758698,14758700,14758706,14758711,14758718,14758720,14758726,14758731,14758732,14758758,14758760,14758766,14758768,14758771,14758772,14758778,14758780,14758786,14758788,14758791,14758792,14758798,14758800,14758806,14758808,14758811,14758812,14758818,14758820,14758826,14758828,14758829,14758831,14758832,14759218,14759220,14759226,14759231,14759258,14759260,14759266,14759271,14759278,14759280,14759286,14759291,14759294,14759299));
 Unique  (cost=0.57..0.58 rows=1 width=8) (actual time=200484.526..200484.536 rows=0 loops=1)
   ->  Custom Scan (SkipScan) on _hyper_6_1328_chunk  (cost=0.57..0.57 rows=1 width=8) (actual time=200484.524..200484.532 rows=0 loops=1)
         ->  Index Only Scan using "1328_989_trends_pkey" on _hyper_6_1328_chunk  (cost=0.57..11469897.98 rows=1 width=8) (actual time=200484.480..200484.512 rows=0 loops=1)
               Index Cond: ((itemid > NULL::bigint) AND (clock >= 1689588000))
               Filter: ((itemid = ANY ('{14758658,14758660,14758666,14758671,14758678,14758680}'::bigint[])) OR (itemid = ANY ('{14758686,14758691,14758698,14758700,14758706,14758711,14758718,14758720,14758726,14758731,14758732,14758758,14758760,14758766,14758768,14758771,14758772,14758778,14758780,14758786,14758788,14758791,14758792,14758798,14758800,14758806,14758808,14758811,14758812,14758818,14758820,14758826,14758828,14758829,14758831,14758832,14759218,14759220,14759226,14759231,14759258,14759260,14759266,14759271,14759278,14759280,14759286,14759291,14759294,14759299}'::bigint[])))
               Heap Fetches: 0
 Planning Time: 1.283 ms
 Execution Time: 200484.667 ms
(8 rows)
EXPLAIN analyze select itemid from trends where clock>=1689588000 and (itemid in (14758658,14758660,14758666,14758671,14758678,14758680) or itemid in (14758686,14758691,14758698,14758700,14758706,14758711,14758718,14758720,14758726,14758731,14758732,14758758,14758760,14758766,14758768,14758771,14758772,14758778,14758780,14758786,14758788,14758791,14758792,14758798,14758800,14758806,14758808,14758811,14758812,14758818,14758820,14758826,14758828,14758829,14758831,14758832,14759218,14759220,14759226,14759231,14759258,14759260,14759266,14759271,14759278,14759280,14759286,14759291,14759294,14759299));
 Index Scan using _hyper_6_1328_chunk_trends_clock_idx on _hyper_6_1328_chunk  (cost=0.57..1.76 rows=1 width=8) (actual time=0.003..0.003 rows=0 loops=1)
   Index Cond: (clock >= 1689588000)
   Filter: ((itemid = ANY ('{14758658,14758660,14758666,14758671,14758678,14758680}'::bigint[])) OR (itemid = ANY ('{14758686,14758691,14758698,14758700,14758706,14758711,14758718,14758720,14758726,14758731,14758732,14758758,14758760,14758766,14758768,14758771,14758772,14758778,14758780,14758786,14758788,14758791,14758792,14758798,14758800,14758806,14758808,14758811,14758812,14758818,14758820,14758826,14758828,14758829,14758831,14758832,14759218,14759220,14759226,14759231,14759258,14759260,14759266,14759271,14759278,14759280,14759286,14759291,14759294,14759299}'::bigint[])))
 Planning Time: 0.795 ms
 Execution Time: 0.015 ms
(5 rows)
The difference at 1000xITEMID is 30 minutes vs 2s.
Our questions:
1. would it be possible to change the query regarding the existence of trends without the "DISTINCT" filter and possibly checking duplicated records on the zabbix server side?
2. the current chunk_time_interval setting for the trends table is 30 days. As I wrote, our environment is quite large. Is it a good idea to change the chunk_time_interval to a smaller value like 14 or 7 days? We found a topic that advises against reducing this time, hence my question. https://support.zabbix.com/browse/ZBX-16347
|
|
I can confirm the existence of this problem. It also impactful for our PostgreSQL + timescaledb installation with required server performance of 3340 new values per second.
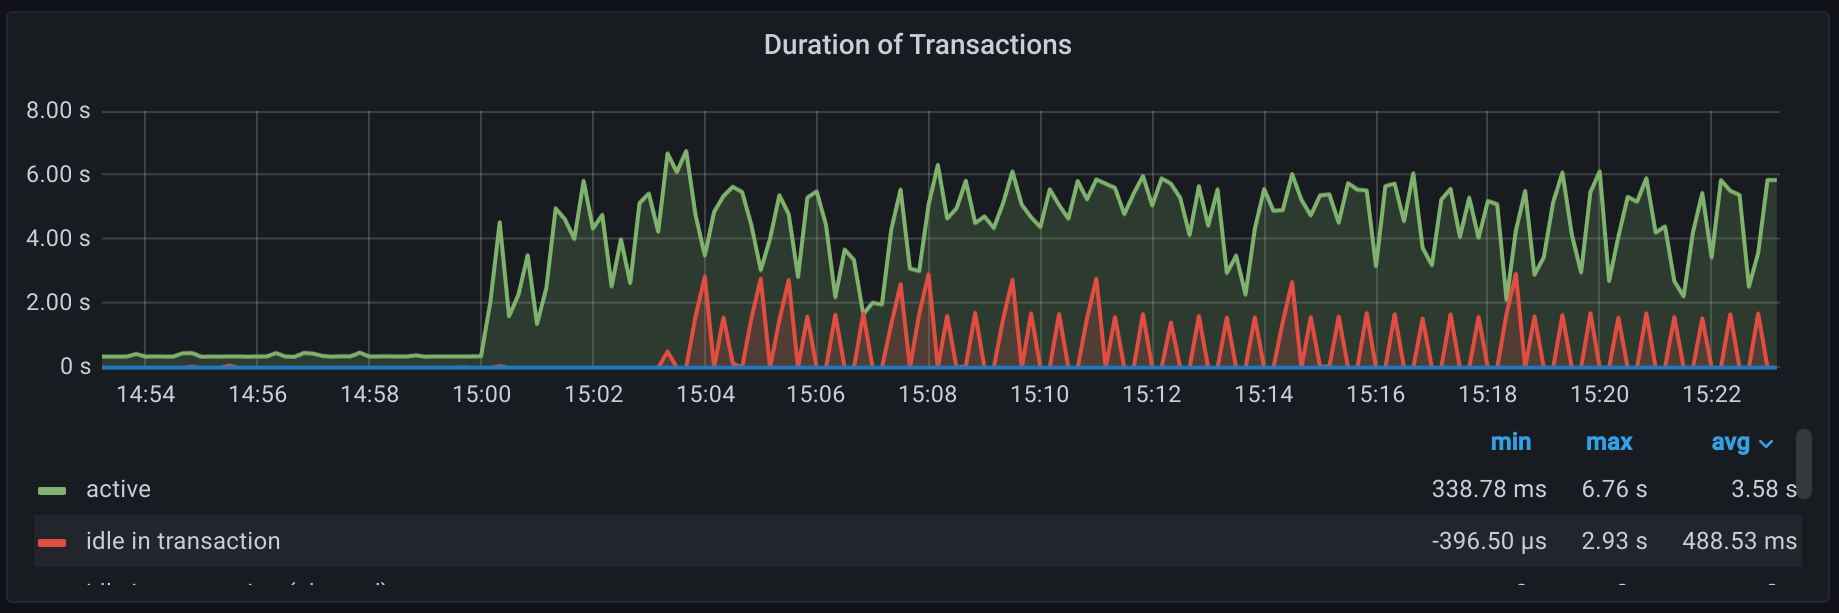
I have also noticed delays in trigger action execution when mentioned trend select queries are running at the end of each hour.
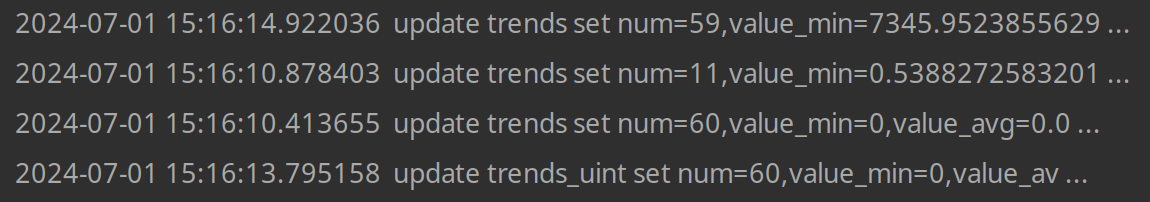
The timeline of the problem shows that the trigger fires for a short period of time, at the same time the trend select query is executed. Then I observe that the action for the trigger sends a notification only after the trends select query is done. I was able to notice this correlation because said trends select queries are also reflected in Zabbix server log as slow queries:
|