|
Replenish:
I am currently not using any plugins, just installed zabbix-agent2. The last agent2 version I used was 6.4.3. It didn't have this problem.
|
|
Hello
Please attach to the issue as a text file output from:
Where 653408 is the pid from the above example given by you, if it's changed, find it first with ps/pgrep utils.
Regards,
Edgar
|
|
metrics and smaps:
metrics.txt smaps.txt smaps.txt
|
|
Please install GDB and execute:
Also provide:
Compress and attach to the issue '/tmp/ZBX-23076.mem.dump', if file size will be more than 15MB, share using public cloud provider like Google Drive, Dropbox, etc...
|
|
cat /proc/79151/maps:
maps.txt
ZBX-23076.mem.dump.zip
|
|
Thank you.
Also is it possible to share the configuration file?
|
|
Already shared, please check the attachment. zabbix_agent2.conf
|
|
Apply this patch:
pprof_patch.diff
Build Agent 2 on this system, after execute:
|
|
./configure --enable-agent2 --enable-ipv6 --with-libcurl --with-libxml2 --with-openssl
make -j4
cp src/go/bin/zabbix_agent2 /usr/sbin/zabbix_agent2
Executing the command will generate these two files:
/root/pprof/pprof.zabbix_agent2.alloc_objects.alloc_space.inuse_objects.inuse_space.001.pb.gz
/root/pprof/pprof.zabbix_agent2.alloc_objects.alloc_space.inuse_objects.inuse_space.002.pb.gz
Do you need both files?
|
|
Same problem here. RAM usage inits with 22mb and goes up until hit 100% available from the server.
|
|
Same issue here too, on 6.0.19.
|
|
Kane yes, please. You can share using public cloud if their size exceeds 15MB.
|
|
pprof.zabbix_agent2.alloc_objects.alloc_space.inuse_objects.inuse_space.002.pb.gz
pprof.zabbix_agent2.alloc_objects.alloc_space.inuse_objects.inuse_space.001.pb.gz
@edgar.akhmetshin Can you test it yourself on a VM? This is a common problem that you can easily notice. You can locate the cause of the problem faster.
|
|
Thank you, we will check.
|
|
Hello Kane
Is it possible to run that pprof enabled version for a longer period of time (catch 500mb usage and execute once again go tool command to get files), unfortunately we are not able to reproduce the issue locally.
Currently we can see only this from the debug given:
Regards,
Edgar
|
|
This could be related, please try building with latest go version and see if issue persists.
https://github.com/gin-contrib/gzip/issues/26
|
|
Latest packages are already build with GO 1.20.6, please try 6.4.5 package.
|
|
@edgar.akhmetshin I've tried the latest version 6.4.5 and the problem didn't fix.
|
|
Kane
Please apply the patch, give it to work until memory consumption is huge and use pprof to get heap and allocs as done before.
|
|
A question as a user, what would be the best way to mitigate this issue? Installing 6.4.3? Rather than monitoring, zabbix-agent is now causing problems.
|
|
Hello johanvdw
You can follow this:
https://support.zabbix.com/browse/ZBX-23076?focusedCommentId=816128&page=com.atlassian.jira.plugin.system.issuetabpanels%3Acomment-tabpanel#comment-816128
Start such Agent and than collect pprof files for heap and allocs, this will help us to find the root cause or may be you can share exact steps to reproduce the issue, with templates and metrics to use.
Regards,
Edgar
|
|
I'll try applying the patch. We observe the issue on our debian 11 servers.
Servers were configured using the zabbix_agent ansible role. We use TLS.
```
- hosts: debian
vars:
- zabbix_agent_server: xxx
- zabbix_agent2: true
- zabbix_agent2_tlscafile: /usr/share/ca-certificates/xxx_intern.crt
- zabbix_agent2_tlskeyfile: /etc/ssl/private/zabbix-agent.key
- zabbix_agent2_tlscertfile: /etc/ssl/certs/zabbix-agent.pem
- zabbix_agent2_tlsaccept: "cert"
roles:
- community.zabbix.zabbix_agent
- name: monitor in zabbix
vars:
ansible_network_os: community.zabbix.zabbix
ansible_connection: httpapi
ansible_httpapi_port: 443
ansible_httpapi_use_ssl: true
ansible_user: Admin
ansible_httpapi_pass: "{{ zabbix_admin_password }}"
ansible_host: zabbix.xxx.net
ansible_zabbix_url_path: "/"
delegate_to: localhost
community.zabbix.zabbix_host:
ca_cert: "CN=xxx internal IT"
tls_connect: 4
tls_accept: 4
tls_subject: "CN={{ target_host }}"
host_name: "{{ target_host }}"
host_groups:
- Linux servers
interfaces:
- type: agent
ip: "{{ ansible_default_ipv4.address }}"
useip: 0
dns: "{{ target_host }}"
main: 1
link_templates:
- Linux by Zabbix agent
- Systemd by Zabbix agent 2
```
I made the switch to both ssl and agent2 in the same run on those hosts, so it's hard to isolate the cause.
Installed zabbix-agent version was 6.4.4
|
root@localhost:~# go tool pprof http:Fetching profile over HTTP from http:Saved profile in /root/pprof/pprof.zabbix_agent2.alloc_objects.alloc_space.inuse_objects.inuse_space.001.pb.gz
File: zabbix_agent2
Build ID: 42d6d7b71890141fad6b4bf9aee06eceb70766e1
Type: inuse_space
Time: Aug 5, 2023 at 12:41am (HKT)
Entering interactive mode (type "help" for commands, "o" for options)
(pprof) top
Showing nodes accounting for 1418.60kB, 100% of 1418.60kB total
Showing top 10 nodes out of 18
flat flat% sum% cum cum%
902.59kB 63.63% 63.63% 902.59kB 63.63% compress/flate.NewWriter
516.01kB 36.37% 100% 516.01kB 36.37% reflect.addReflectOff
0 0% 100% 902.59kB 63.63% compress/flate.NewWriterDict
0 0% 100% 902.59kB 63.63% compress/zlib.(*Writer).Write
0 0% 100% 902.59kB 63.63% compress/zlib.(*Writer).writeHeader
0 0% 100% 516.01kB 36.37% git.zabbix.com/ap/plugin-support/plugin.RegisterMetrics
0 0% 100% 516.01kB 36.37% git.zabbix.com/ap/plugin-support/plugin.registerMetric
0 0% 100% 516.01kB 36.37% reflect.(*rtype).Method
0 0% 100% 516.01kB 36.37% reflect.FuncOf
0 0% 100% 516.01kB 36.37% reflect.resolveReflectName (inline)
(pprof) exit
root@localhost:~# go tool pprof http:Fetching profile over HTTP from http:Saved profile in /root/pprof/pprof.zabbix_agent2.alloc_objects.alloc_space.inuse_objects.inuse_space.002.pb.gz
File: zabbix_agent2
Build ID: 42d6d7b71890141fad6b4bf9aee06eceb70766e1
Type: alloc_space
Time: Aug 5, 2023 at 12:41am (HKT)
Entering interactive mode (type "help" for commands, "o" for options)
(pprof) top
Showing nodes accounting for 31.41GB, 92.34% of 34.01GB total
Dropped 296 nodes (cum <= 0.17GB)
Showing top 10 nodes out of 55
flat flat% sum% cum cum%
21.43GB 62.99% 62.99% 26.15GB 76.89% compress/flate.NewWriter
4.58GB 13.47% 76.46% 4.58GB 13.47% compress/flate.(*compressor).initDeflate (inline)
1.49GB 4.39% 80.85% 1.49GB 4.39% bytes.growSlice
0.98GB 2.87% 83.72% 0.98GB 2.87% compress/flate.(*dictDecoder).init (inline)
0.88GB 2.60% 86.32% 0.88GB 2.60% bufio.(*Scanner).Scan
0.55GB 1.62% 87.94% 0.58GB 1.69% zabbix.com/pkg/tls.NewServer
0.49GB 1.43% 89.37% 0.49GB 1.44% zabbix.com/plugins/proc.read2k
0.40GB 1.19% 90.56% 0.40GB 1.19% net.dnsPacketRoundTrip
0.34GB 0.99% 91.55% 1.56GB 4.59% zabbix.com/pkg/zbxcomms.(*Connection).read
0.27GB 0.79% 92.34% 0.93GB 2.73% zabbix.com/plugins/proc.getProcessState
(pprof) exit
new pprof:
pprof-2023-08-055-1.zip
@edgar.akhmetshin
The problem can be reproduced on any debian server, but it takes a long time to wait for the memory leak.
Please consider raising the priority, the current issue is not trivial.
|
Total: 34.01GB
ROUTINE ======================== compress/flate.NewWriter in /usr/local/go/src/compress/flate/deflate.go
21.43GB 26.15GB (flat, cum) 76.89% of Total
. . 665:func NewWriter(w io.Writer, level int) (*Writer, error) {
21.43GB 21.43GB 666: var dw Writer
. 4.73GB 667: if err := dw.d.init(w, level); err != nil {
. . 668: return nil, err
. . 669: }
. . 670: return &dw, nil
. . 671:}
. . 672:
ROUTINE ======================== compress/flate.NewWriterDict in /usr/local/go/src/compress/flate/deflate.go
1MB 26.14GB (flat, cum) 76.86% of Total
. . 679:func NewWriterDict(w io.Writer, level int, dict []byte) (*Writer, error) {
1MB 1MB 680: dw := &dictWriter{w}
. 26.14GB 681: zw, err := NewWriter(dw, level)
. . 682: if err != nil {
. . 683: return nil, err
. . 684: }
. . 685: zw.d.fillWindow(dict)
. . 686: zw.dict = append(zw.dict, dict...)
|
|
Is issue reproducible when monitoring logs, or using global regular expressions or perhaps when TLS is used ?
|
|
On my side, I can reproduce only when I enable an item that uses log or log.count. I use regex on those items to identify some patterns in the logs.
After turning on these items, in less than 48h I already have almost 90% of RAM in use (versus 50% on average, when turned off)
|
|
Could you please be so kind and share if there is something unusual with those items, at least if global regular expression is used or ordinary and if possible please share regexp.
Also if it was compiled with --with-libpcre2 or --with-libpcre
Please show output of lld:
ldd ./sbin/zabbix_agent2
|
|
I am using the already compiled version 6.4.4 agent2, available here: https://repo.zabbix.com/zabbix/6.4/ubuntu/pool/main/z/zabbix-release/(...).deb
ldd output:
linux-vdso.so.1 (0x00007ffd27bdd000)
libpcre2-8.so.0 => /lib/x86_64-linux-gnu/libpcre2-8.so.0 (0x00007fa64ff1b000)
libz.so.1 => /lib/x86_64-linux-gnu/libz.so.1 (0x00007fa64feff000)
libssl.so.3 => /lib/x86_64-linux-gnu/libssl.so.3 (0x00007fa64fe5b000)
libcrypto.so.3 => /lib/x86_64-linux-gnu/libcrypto.so.3 (0x00007fa64fa19000)
libc.so.6 => /lib/x86_64-linux-gnu/libc.so.6 (0x00007fa64f7f1000)
/lib64/ld-linux-x86-64.so.2 (0x00007fa64ffb9000)
About the regex, nothing out of the ordinary. just to filter by log severity.
Example: log[/home/ubuntu/.pm2/logs/api-out.log,.*critical 20.*,,10,all]
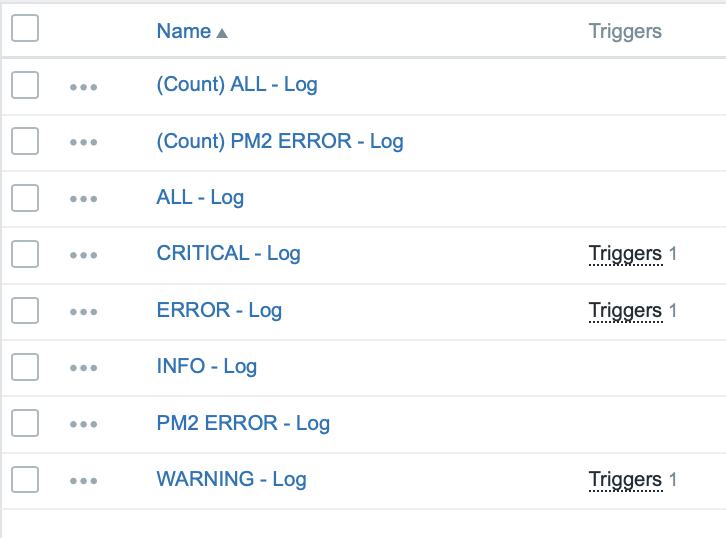
My host template with log has 8 log items, like the example below. All follow the same regex pattern, changing only the keyword (or the non-existence of them, with "ALL").
|
|
Also please see:
ZBX-22943
|
|
Is encryption used, could that be the cause ? ZBX-23221
|
|
Duplicates https://support.zabbix.com/browse/ZBX-23221
|
Generated at Mon May 11 18:02:16 EEST 2026 using Jira 10.3.18#10030018-sha1:5642e4ad348b6c2a83ebdba689d04763a2393cab.
