|
Duplicate |
|||
|
Sub-task |
|||
| depends on | ZBX-26989 | Improve Kubernetes cluster state by H... | Confirmed |

[ZBX-24504] Proxy monitoring kubernetes cluster is too resource hungry Created: 2024 May 17 Updated: 2026 Feb 04 Resolved: 2025 Oct 28 |
|
| Status: | Closed |
| Project: | ZABBIX BUGS AND ISSUES |
| Component/s: | Server (S), Templates (T) |
| Affects Version/s: | 6.4.13, 6.4.14 |
| Fix Version/s: | 7.0.20rc1, 7.4.4rc1, 8.0.0alpha1 |
| Type: | Problem report | Priority: | Major |
| Reporter: | Robin Roevens | Assignee: | Andris Zeila |
| Resolution: | Fixed | Votes: | 7 |
| Labels: | Proxy, Template, helm, kubernetes | ||
| Remaining Estimate: | Not Specified | ||
| Time Spent: | 14h | ||
| Original Estimate: | Not Specified | ||
| Environment: |
SLES 15 SP5 |
||
| Attachments: |
|
||||||||||||
| Issue Links: |
|
||||||||||||
| Team: | |
||||||||||||
| Sprint: | S25-W40/41, S25-W42/43 | ||||||||||||
| Story Points: | 2 | ||||||||||||
| Description |
|
We have set up a few K3s clusters, monitored by Zabbix using the Zabbix provided Kubernetes templates (updated to latest available for git.zabbix.com tag 6.4.14) and helm charts. Most clusters do not yet have much workload, and are monitored without problems using these resource limits on the proxy pod in the cluster:
However one cluster (also 3 cp's, 4 workers) has a much higher load of 192 deployments, 523 replicasets (most of them are 'old', inactive sets that are keps by kubernetes for deployment rollback purposes) and 221 pods. I don't think this is already a very big load for a kubernetes cluster, and there are also about 120 additional projects scheduled to be deployed on that cluster, so the load will only grow. I have already altered the Kubernetes cluster state template to skip replicasets with 0 replica's to filter out the inactive replicasets preventing about 1500 extra items from being discovered. This currently results in Zabbix trying to monitor +/- 26000 items on 29 hosts for that cluster. This however proves to be very challenging for the Proxy on that cluster as the 3 default preprocessors are 100% busy and the proxy crashes regularly due to a lack of available preprocessor workers. So we start scaling up the proxy. Currently it is set to I could still up the allowed resources, preprocessors and pollers. But I think this getting way out of proportion, the consumed resources, only for monitoring. Also it strikes me that with only the defaults it is able to monitor 18000 items, but only 8000 more items would suddenly need over 60 preprocessors more, and at least 3 times the default resource limits. This looks to me like there is some turnover point where resources are suddenly exponentially required for only a little more data. The culprit seems to be the Kubernetes cluster state by HTTP template: Get state metrics which currently returns 37113 lines on that cluster and is then preprocessed by almost all other discovered items. Possibly the preprocessing can be optimized? And/or the template itself? |
| Comments |
| Comment by Vladimir Povetkin [ 2025 Jan 20 ] |
|
We have similar issue. Preprocessor queue growing for K8S cluster with 30k items |
| Comment by Mateusz Mazur [ 2025 Mar 24 ] |
|
same problem here |
| Comment by Samuele Bianchi [ 2025 Mar 26 ] |
|
I can confirm this problem using zabbix 7.0.10 release on Debian 12
I have increased the preprocessing number of instances to 30, but the problem is still present. |
| Comment by Artūras Kupčinskas [ 2025 Mar 27 ] |
|
Hi, First we change deployment and replicaset triggers on template (because those data is stuck on postprocesing) :
old: and last(/Kubernetes cluster state by HTTP without POD/kube.replicaset.replicas_desired{#NAMESPACE}/{#NAME})>=0 and last(/Kubernetes cluster state by HTTP without POD/kube.replicaset.ready{#NAMESPACE}/{#NAME})>=0 new: abs(min(/Kubernetes cluster state by HTTP without POD/kube.replicaset.replicas_desired{#NAMESPACE}/{#NAME},{$KUBE.REPLICA.MISMATCH.EVAL_PERIOD:"replicaset:{#NAMESPACE} :{#NAME}"}) - min(/Kubernetes cluster state by HTTP without POD/kube.replicaset.ready{#NAMESPACE}/{#NAME},{$KUBE.REPLICA.MISMATCH.EVAL_PERIOD:"replicaset: {#NAMESPACE}:{#NAME}"}))>0and last(/Kubernetes cluster state by HTTP without POD/kube.replicaset.replicas_desired{#NAMESPACE}/{#NAME})>=0 and last(/Kubernetes cluster state by HTTP without POD/kube.replicaset.ready{#NAMESPACE}/{#NAME})>=0 old: min(/Kubernetes cluster state by HTTP without POD/kube.deployment.replicas_mismatched{#NAMESPACE}/{#NAME},{$KUBE.REPLICA.MISMATCH.EVAL_PERIOD:"deployment:{#NAMESPACE} :{#NAME}"})>0 new: :{#NAME}"}))>0
We also created a second helm yaml to have two separate zabbix-proxy. We ran everything related to Pod discovery through one, and everything else in the other proxy. This solved the resource issue for us. |
| Comment by Vladislavs Sokurenko [ 2025 Jul 29 ] |
|
Could you please be so kind and provide on Zabbix proxy and Zabbix server 7.0.17 zabbix_proxy-R diaginfo="preprocessing" |
| Comment by Mateusz Mazur [ 2025 Jul 29 ] |
|
I will provide after upgrading to 7.0.17 in few day |
| Comment by Genadijs Jeniceks [ 2025 Aug 06 ] |
|
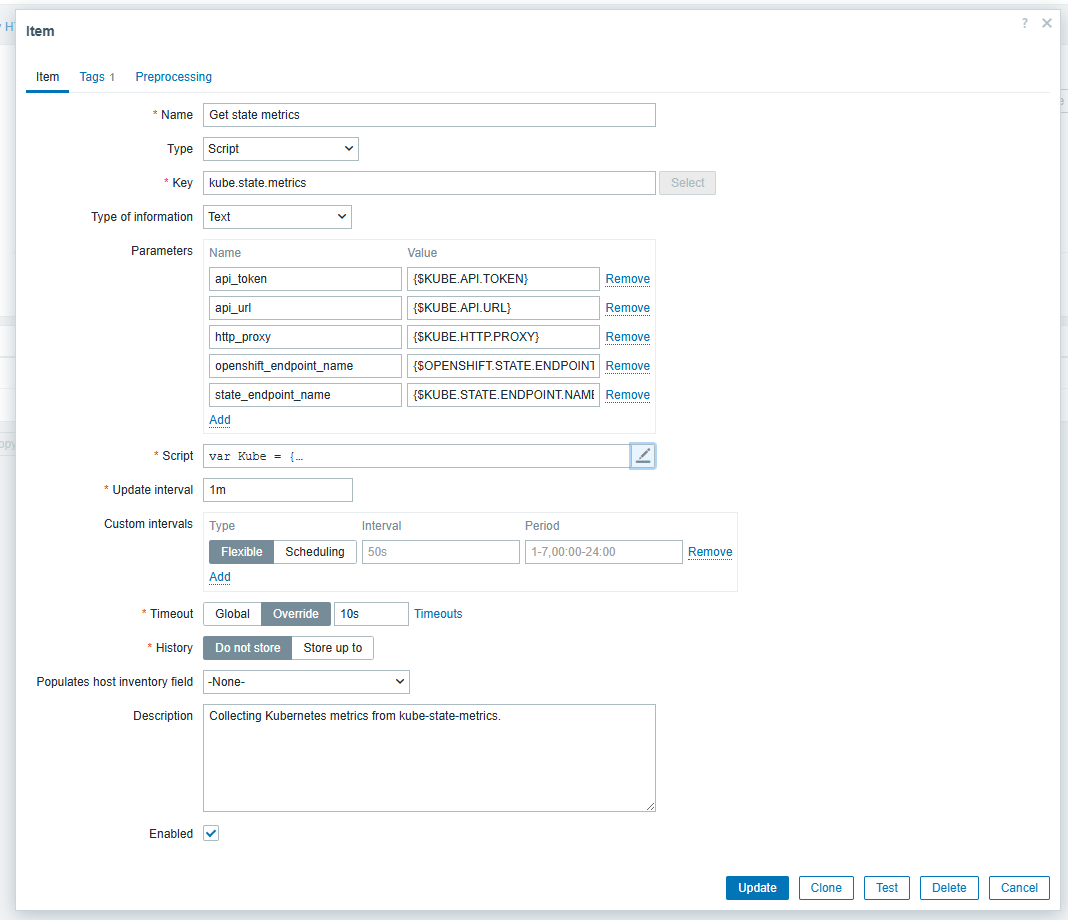
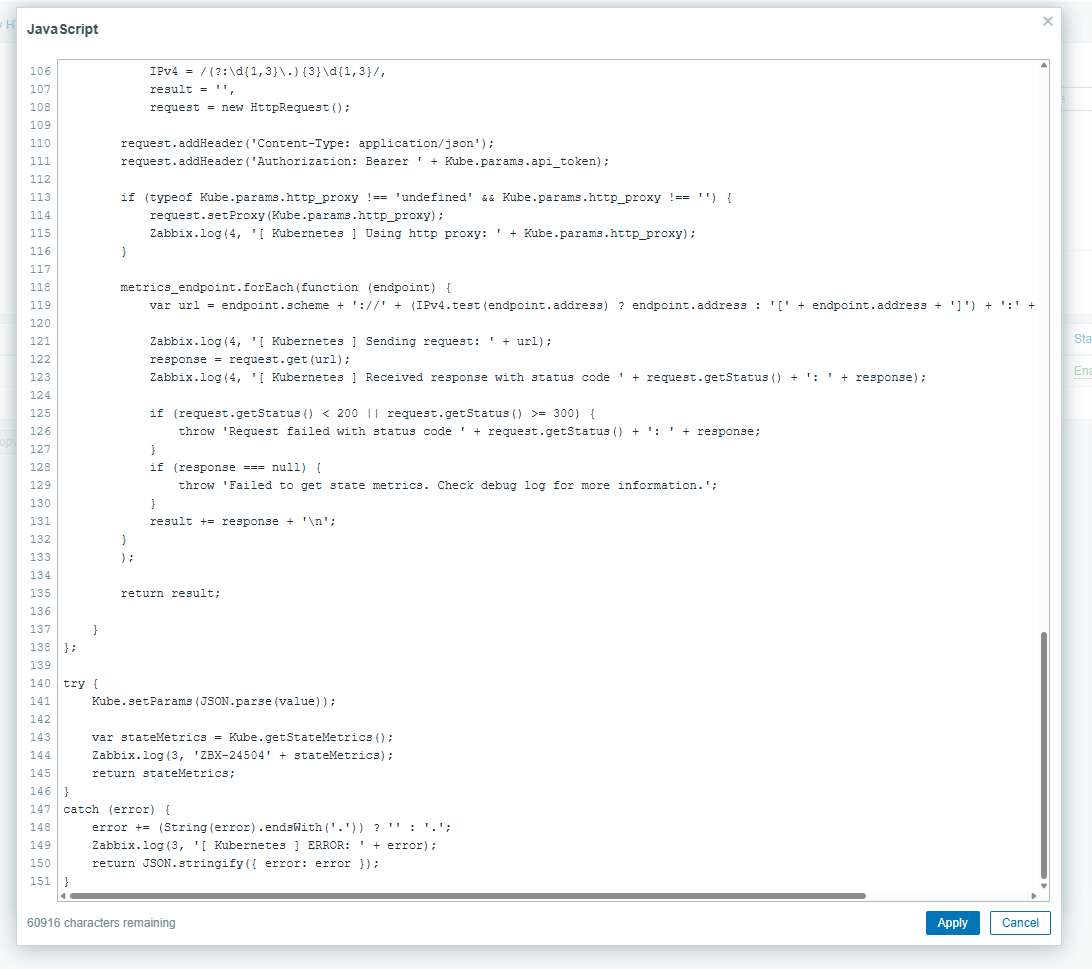
Hello, robinr, mateusz.mazur We would like to get from you the full JSON key object returned by "Get state metrics" item to reproduce the issue. For this you should modify JavaScript script for the "Get state metrics" in the "Kubernetes cluster state by HTTP" template. To follow best practices and avoid extra load you can clone the the template and remove all items and discovery rules except "Get state metrics" item only . Than modify the Script by adding Zabbix.log(3, 'ZBX-24504' + stateMetrics); to 144 line (please, check the pictures). cat /var/log/zabbix/zabbix_server.log | grepZBX-24504 > get_state_metrics.json and send us the "get_state_metrics.json" file. |
| Comment by Robin Roevens [ 2025 Sep 03 ] |
|
gjeniceks: I have yet to migrate to Zabbix 7, so this is generated on Zabbix 6.4: get_state_metrics.json.xz |
| Comment by Andris Zeila [ 2025 Oct 15 ] |
|
Released
|
| Comment by Mateusz Mazur [ 2025 Oct 30 ] |
|
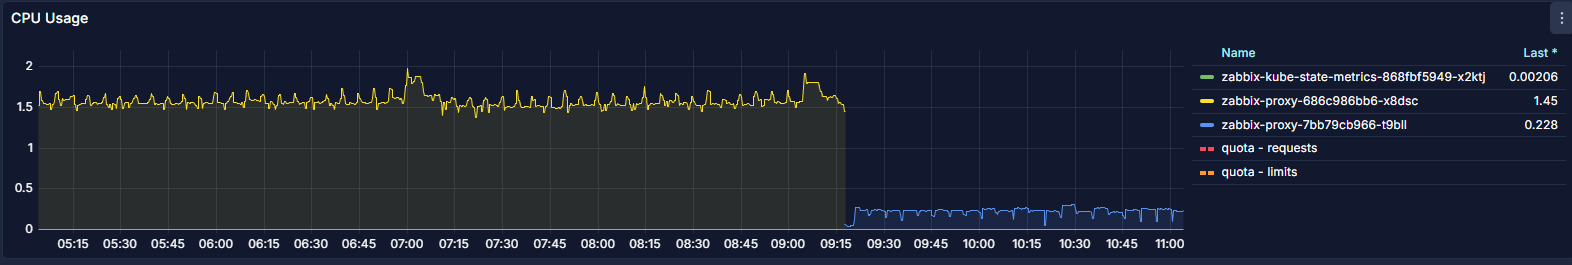
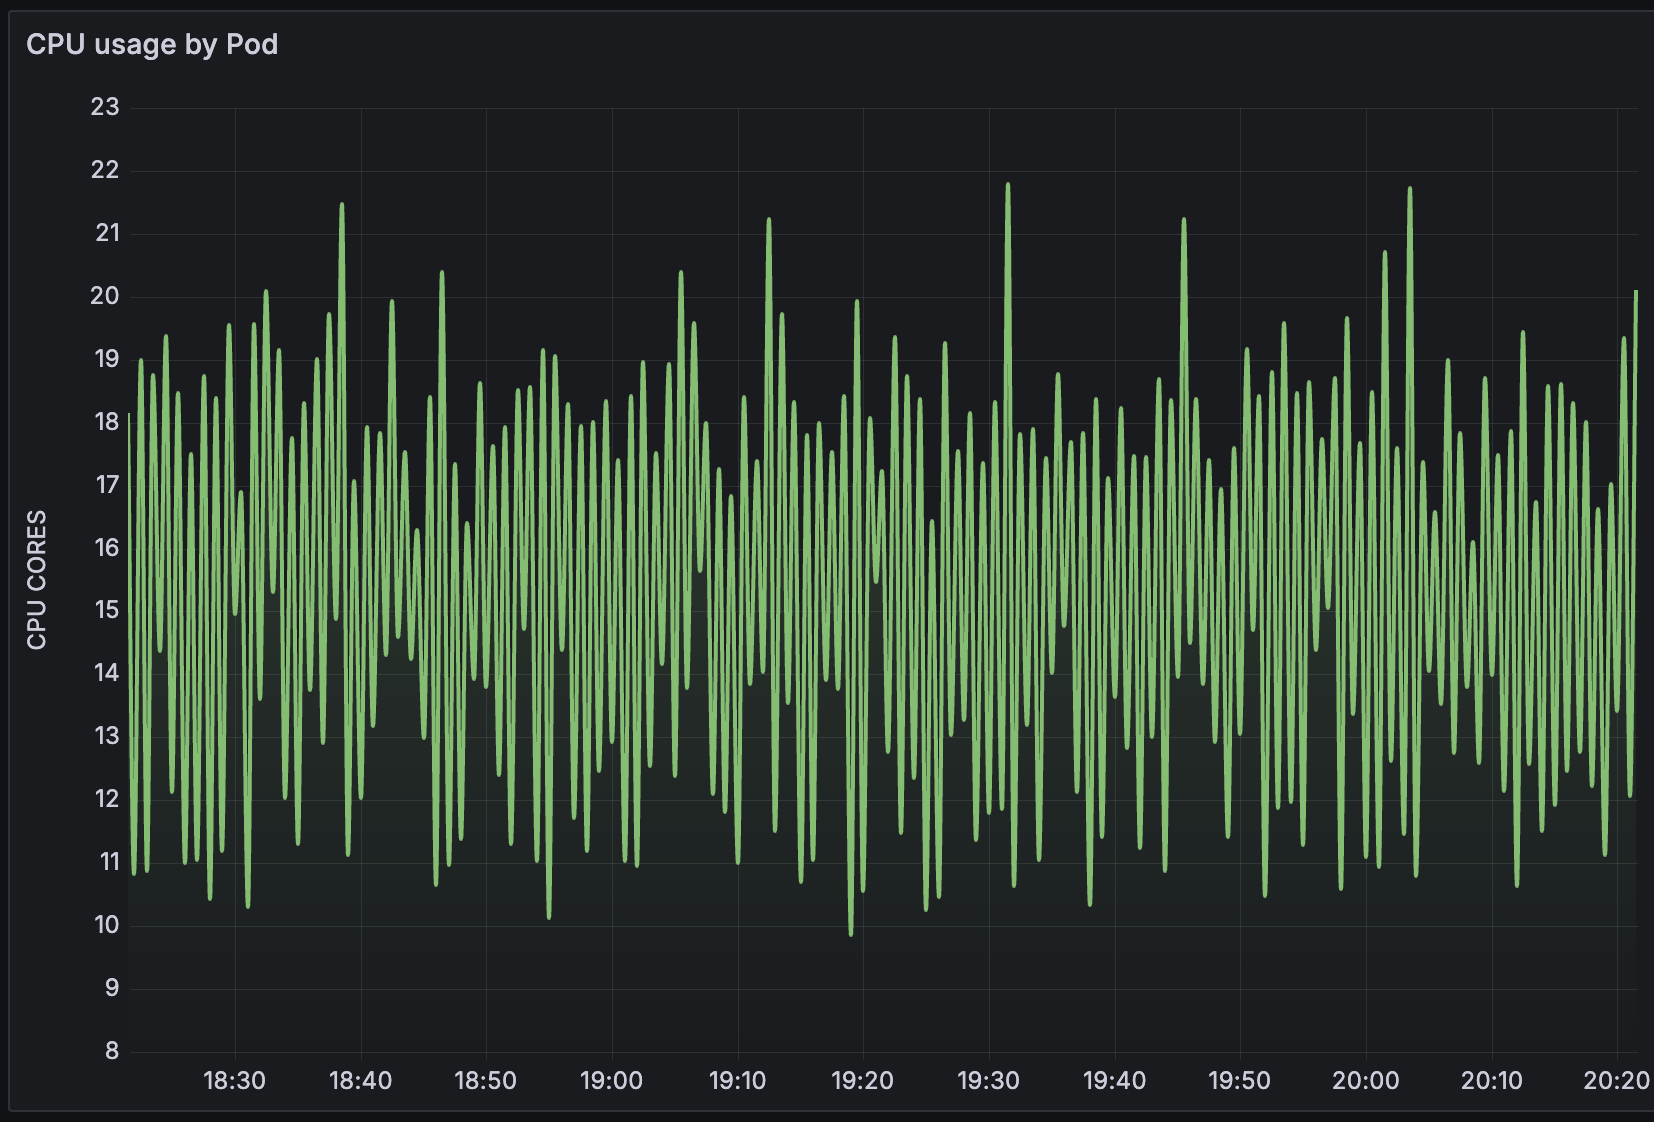
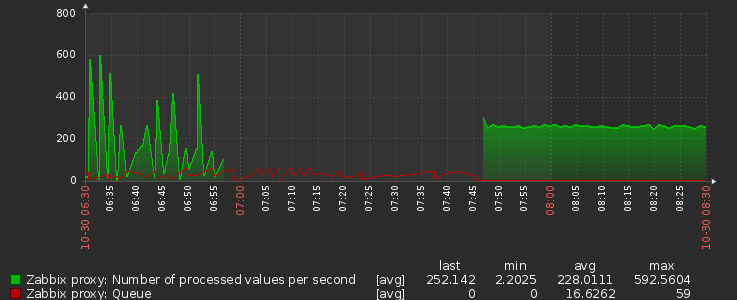
Installed zabbix proxy 7.0.20 and its looking good. CPU usage dropped nicely on zabbix proxy
And queue on zabbix-server looks good now
|
| Comment by Lasse Bang Mikkelsen [ 2025 Nov 24 ] |
|
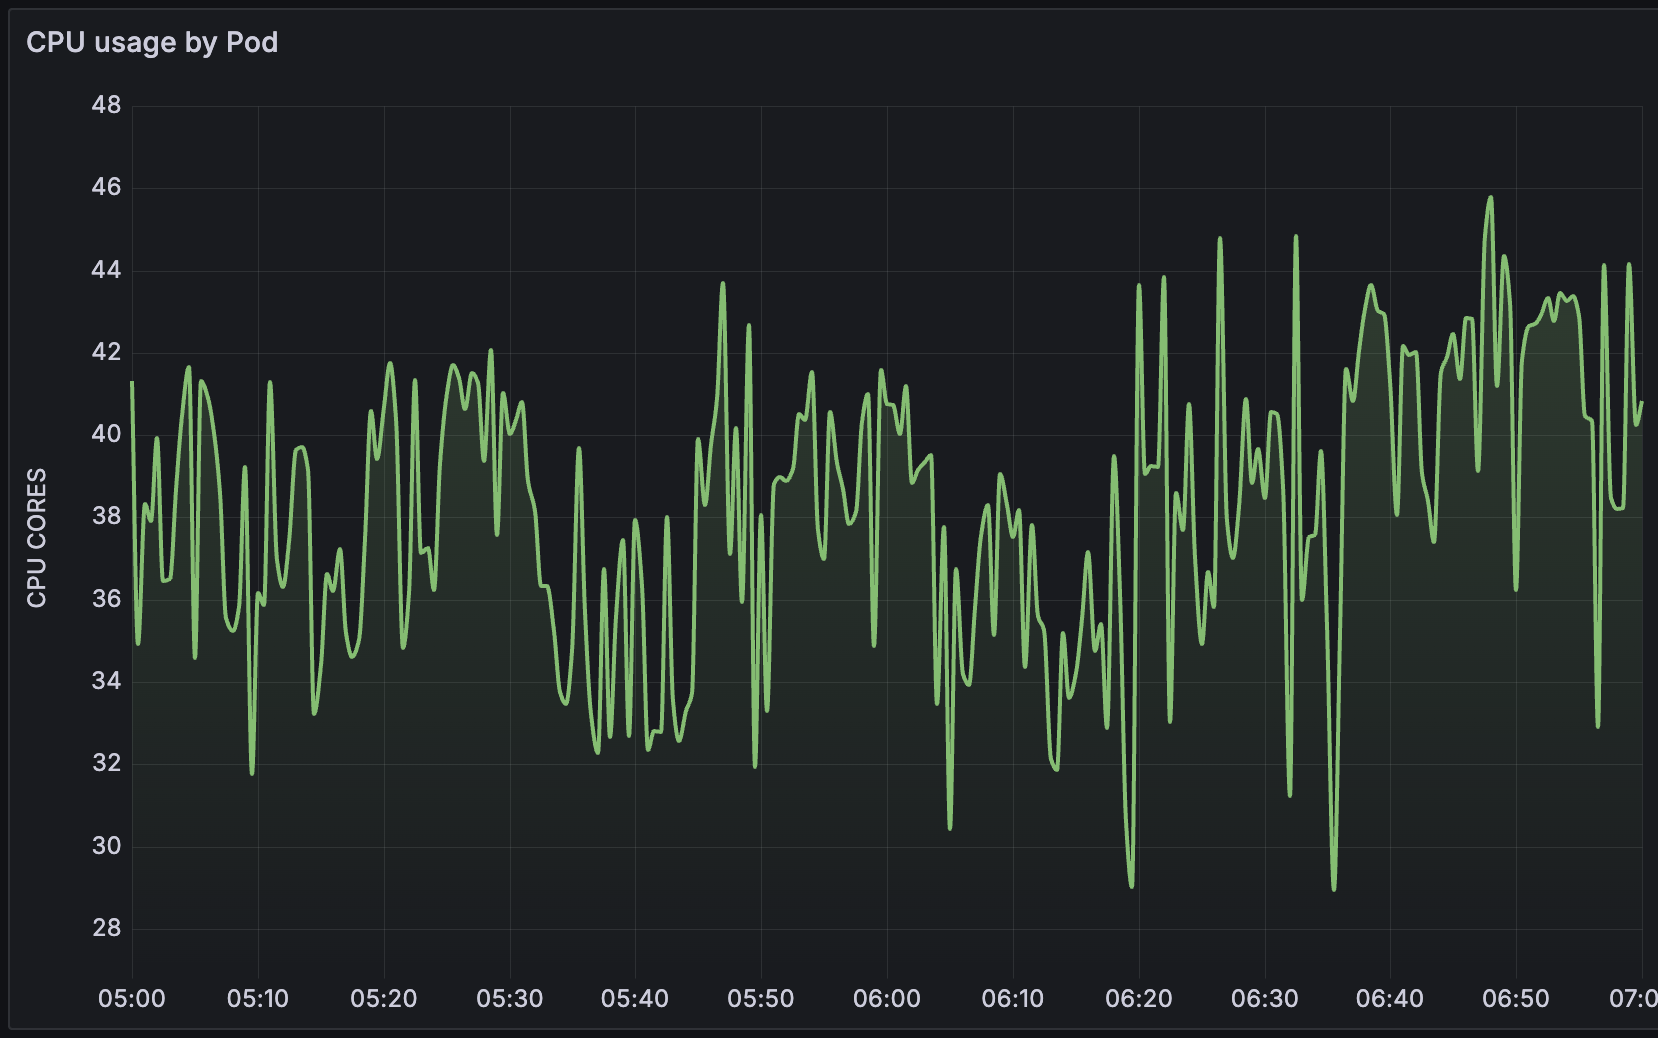
gjeniceks We've seen a great performance increase with 7.0.20, but CPU usage is still far too high. This is CPU usage on AMD EPYC 7502P @ 2.5 GHz. Zabbix proxy 7.0.17:
Zabbix proxy 7.0.20:
Zabbix performance 7.0.17 vs. 7.0.20:
We're ready to help debug this issue if needed.
|
| Comment by Vladislavs Sokurenko [ 2025 Nov 25 ] |
|
Please send us file with metrics as mentioned above and we can try reproducing the issue. |
| Comment by Lasse Bang Mikkelsen [ 2025 Nov 26 ] |
|
vso Please see attached diaginfo from Zabbix proxy 7.0.20: zabbix-proxy-7-0-20-diaginfo-preprocessing.txt |
| Comment by Vladislavs Sokurenko [ 2025 Nov 28 ] |
|
It was meant like gjeniceks mentioned to provide us with metrics.json please. You can also check from diaginfo what is this item and what preprocessing it have: As it is executed too long, please provide javascript for it. |
| Comment by Lasse Bang Mikkelsen [ 2025 Nov 28 ] |
|
vso As the metrics are large (~9M) and not anonymized, can I e-mail or upload securely? |
| Comment by Vladislavs Sokurenko [ 2025 Nov 29 ] |
|
It’s possible to send to [email protected] or if still does not ft I can provide instructions how to upload to us. |
| Comment by Lasse Bang Mikkelsen [ 2025 Nov 29 ] |
|
vso I've e-mailed you the files, thanks! |
| Comment by Lasse Bang Mikkelsen [ 2025 Dec 08 ] |
|
vso Let me know if you need more. |
| Comment by Vladislavs Sokurenko [ 2025 Dec 08 ] |
|
Thank you very much for provided information, issue was reproduced and we are working on it. |
| Comment by Lasse Bang Mikkelsen [ 2026 Feb 04 ] |
|
vso As this issue is closed, is the work tracked elsewhere? Thanks. |
| Comment by Vladislavs Sokurenko [ 2026 Feb 04 ] |
|
Yes, there are some optimizations planned, I will keep you updated once there is more information. |